
Proxmox VE
Este conteúdo não está disponível em sua língua ainda.
Hypervisor: nodes with their daemons and networking, virtual machines, containers, storages, LVM thin pools, backups, high availability, snapshots, replication, Ceph down to the OSD, physical disks and ZFS pools, pending updates, package changes, subscription and certificates. One monitor can cover a whole cluster.
Network ports to open
Section titled “Network ports to open”From the DumbMonit server (or its relay agent) to the device:
| Port | Protocol | Purpose |
|---|---|---|
| 8006 | TCP | API (HTTPS, default) |
The nodes panel
Section titled “The nodes panel”The monitor page opens on one card per node: CPU, memory and root filesystem as
three meters, the uptime and the pve-manager version installed on that node,
then only what is wrong — the daemons that are not running, the interfaces
declared at boot that are not up — and the fill of each LVM thin pool and
volume group. A node that stopped answering keeps its card and reads offline.
Two lines under the meters, when the node reports them: the share of CPU time spent waiting on storage (I/O wait — a node at 10 % CPU and 30 % I/O wait has no headroom left, and no other number says so) and the memory KSM has reclaimed by sharing identical pages between guests, which is how a node hosts more than its RAM.
Two more entries join the “what is wrong” list, both in words:
- Reboot required — a newer kernel is installed than the one running. The
card names both versions, since the node keeps running the old one until it
is rebooted. This comes from
/nodes/{node}/apt/versions, which only needsSys.Audit; - Updates pending — how many Proxmox packages have a newer candidate
version, from the same call. It is not the same thing as
apt/update, which counts every pending package of the system but needsSys.Modifyand is usually refused.
When the cluster reports an HA watchdog (Proxmox VE 9 and later), its state is stated beside the panel title: HA fencing armed once resources are handed to HA, HA fencing standby while none are — in which case no node will be fenced, which is normal but worth knowing before counting on it.
A cluster upgraded node by node shows it here: /version answers for the node
that was asked, so each card carries its own version and a straggler is
visible without opening a shell.
The data comes from GET /api/targets/{id}/proxmox/nodes, read from the last
probe in the metrics store.
The guests panel
Section titled “The guests panel”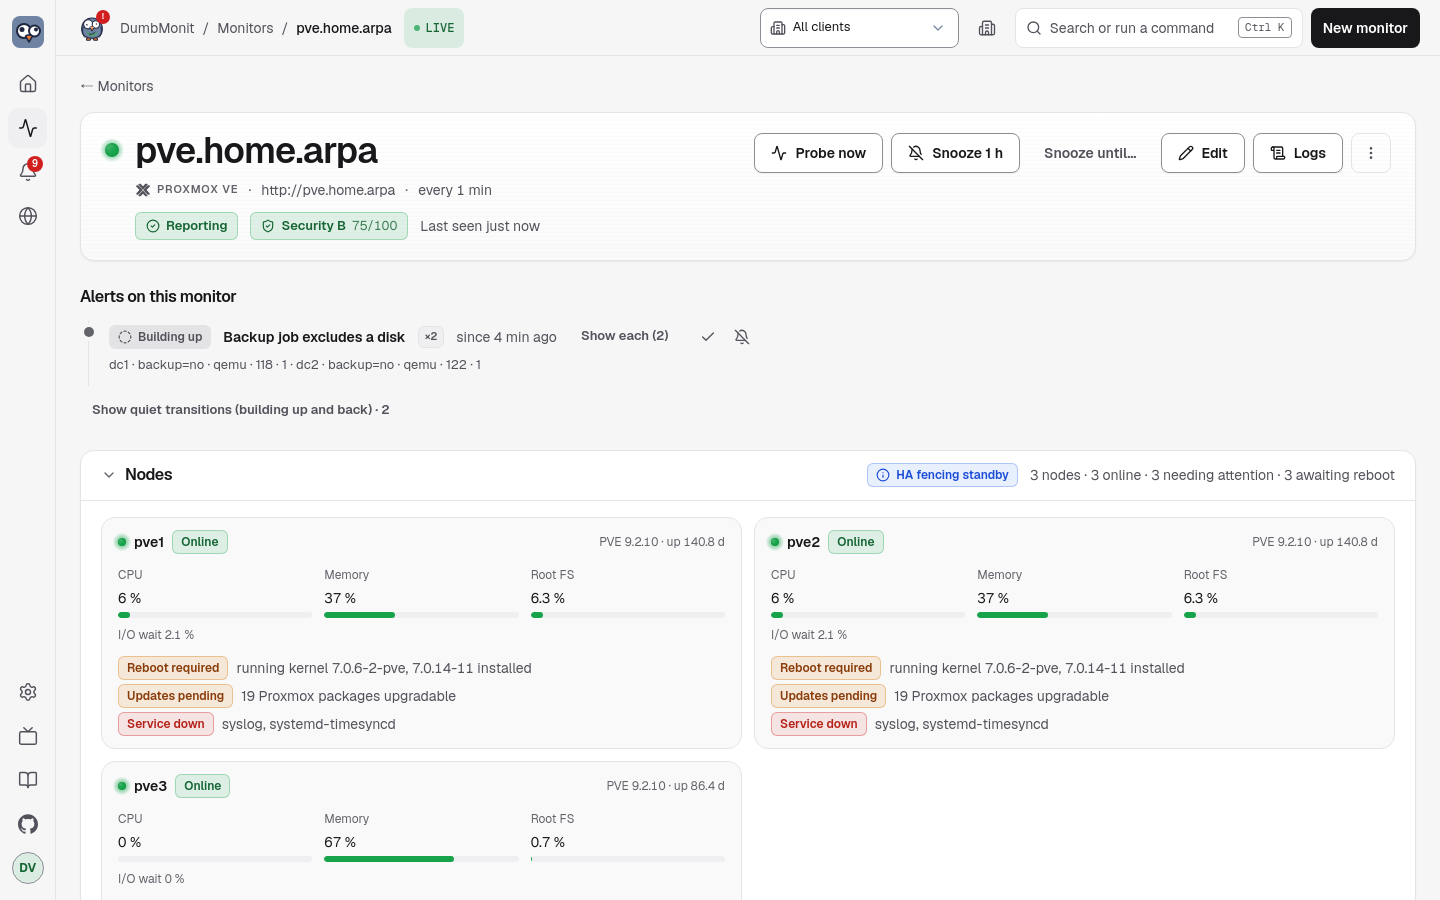
Below the nodes, the Guests panel: one row per virtual machine and container, grouped by node, that answers the questions an administrator asks first — is it running, is it busy, is its disk full, when was it last backed up. Each row shows:
| Column | Source | Notes |
|---|---|---|
| Status | word + plate: running, stopped, paused, suspended, template | A template is listed but never counts as “stopped”. |
| Name, VMID, node | the inventory | |
| CPU | guest_cpu_percent, of the cores allocated to the guest | A bar plus the number of cores. |
| Memory | guest_memory_used_bytes / guest_memory_total_bytes | The balloon size when the VM has one. A second line, +N on host, appears when guest_memory_host_bytes is meaningfully above what the guest sees: a QEMU process costs the hypervisor more than the memory it hands over, and that surplus is the emulation overhead. Below 64 MiB or 5 % the line stays out. |
| Disk | guest_disk_used_bytes / guest_disk_total_bytes | Containers: real usage. VMs: size always; usage only when the QEMU guest agent answers (see below), otherwise “size only”. |
| Network | rate(guest_network_in/out_bytes) over the last probes | |
| Uptime | guest_uptime_seconds | |
| Last backup | backup_last_age_seconds | Empty when no backup is known. |
| HA | ha_resource_state_info | Only for guests under high availability. |
| Lock | guest_locked | A badge, only while a lock is held (backup, migrate, snapshot…). |
The list sorts by any column, filters by node, status or pool, and each node
group folds. Clicking a row opens its CPU and memory over the page’s time
range, along with the operating system and the IP addresses seen from inside
the guest. The data comes from GET /api/targets/{id}/proxmox/guests, which
reads the last probe from the metrics store — nothing is asked of the
hypervisor.
A lock is normal for the few minutes a backup, a migration or a snapshot
takes. Left behind by an interrupted job, it blocks every operation on that
guest — including the next night’s backup — until qm unlock (or pct unlock) clears it, which is why “Guest locked” fires after six hours.
The inventory comes from /cluster/resources, the cluster’s own cache, so the
guests of a node that stopped answering are still listed — with the status
unknown and their sizes, without live measurements — instead of vanishing
from the panel at the moment you want to look at them. It also costs two API
calls fewer per node than walking /nodes/{node}/qemu and /nodes/{node}/lxc,
which is what the cluster_resources option falls back to when turned off.
Disk usage inside a VM: the QEMU guest agent
Section titled “Disk usage inside a VM: the QEMU guest agent”Proxmox sees a VM’s disk as an opaque volume: disk is always 0 for a VM,
only its size is known. To read the usage from inside, the collector asks the
QEMU guest agent (agent/get-fsinfo) for every running VM whose configuration
enables the agent (Options → QEMU Guest Agent). Two conditions:
qemu-guest-agentinstalled and running inside the VM (Debian and Ubuntu:apt install qemu-guest-agent; Windows: the VirtIO drivers ISO);- the token holds
VM.GuestAgent.Auditon the VM —VM.Monitorbefore Proxmox VE 9 (theDumbMonitrole below grants it on/).
The root filesystem (/, or C:\ on Windows; failing that, the largest one)
gives guest_disk_used_bytes and guest_disk_used_percent, the same series a
container has, so the “VM or container disk almost full” rule covers both.
Every real filesystem also gets guest_fs_total/used_bytes and
guest_fs_used_percent with a mountpoint label; pseudo filesystems (tmpfs,
squashfs, snap mounts) and media without capacity are skipped.
guest_agent_enabled says whether the VM’s configuration enables the agent,
guest_agent_running whether it answered. Without the agent or the right, the
VM keeps its size and simply has no usage — never a misleading “0 %”.
The operating system and addresses of a guest
Section titled “The operating system and addresses of a guest”Proxmox only knows the OS type written in a guest’s configuration (l26,
win11), not what actually runs. With the guest_os option on, the collector
asks each running guest what it is: agent/get-osinfo and
agent/network-get-interfaces for a VM, /nodes/{node}/lxc/{vmid}/interfaces
for a container, which needs nothing installed inside. That gives
guest_os_info (Debian GNU/Linux 12 (bookworm), its id, its version, the
kernel) and up to four guest_ip_info — loopback and IPv6 link-local
addresses are skipped, so are Docker bridges, veth pairs and other container
networks (docker0, br-…, veth…, cni…), and a machine with dozens of
virtual interfaces does not fill the series database. When a guest says
nothing about its addresses (a VM without the agent, or without the right to
ask it), the collector falls back on the static addresses of its
configuration (/nodes/{node}/qemu/{vmid}/config cloud-init ipconfigN,
/nodes/{node}/lxc/{vmid}/config netN … ip=; dhcp gives none), which
VM.Audit — part of PVEAuditor — already allows.
The map uses these addresses: a monitor whose address is one of a guest’s (an HTTP check, a TCP port, a database…) is drawn under that VM or container with a “Runs on” link instead of floating on its own, and an agent, ping or SNMP monitor at a guest’s address stands for the guest itself. Host names are not resolved, so only monitors addressed by IP are matched this way (a guest whose name matches a monitor or an agent’s host name is matched by name, as before).
Both are asked at most once an hour per guest and republished from memory in between: an operating system does not change between two probes, and an address almost never does. On a cluster of fifty running machines that is the difference between two extra calls per probe and two per hour.
Those two agent calls need VM.GuestAgent.Audit. Proxmox VE 7 did not have
it and used VM.Monitor; Proxmox VE 9 removed VM.Monitor and keeps only the
guest-agent privileges. Without the one your version knows, the two series are
simply absent; nothing else changes.
The Ceph panel
Section titled “The Ceph panel”A Ceph section appears on the monitor page only when the cluster actually has Ceph: health and the words behind it, total and used capacity, how many OSDs are up and in, a table of OSDs (host, device class, usage, apply and commit latency) and a table of pools (usage, size and min size, placement groups against the number the autoscaler would pick), the CephFS filesystems, the OSD flags left set and the health checks currently muted.
Those last two are the ones a dashboard usually hides. noout set for a
maintenance and never cleared means Ceph will not rebalance out a dead OSD
again, and a muted check no longer shows up in HEALTH_OK — in both cases the
cluster looks healthy while its redundancy quietly disappears.
GET /api/targets/{id}/proxmox/ceph answers available: false when the
cluster has no Ceph, which is how the UI knows not to draw the section at all.
The detail costs three calls on a single node plus two cluster-wide, whatever
the size of the cluster, and it needs the ceph_detail option on top of
ceph.
What it watches
Section titled “What it watches”All metrics are prefixed dumbmonit_proxmox_.
| Family | Metrics | Labels |
|---|---|---|
| Cluster | cluster_quorate, cluster_nodes, cluster_nodes_online, cluster_member_online; version_info (+ version, release, repoid) | cluster, node |
| Cluster inventory | cluster_guests_total, cluster_guests_running, cluster_templates_total (templates counted apart, never as “stopped”); pool_guests, one per resource pool | pool |
| Nodes | node_up, node_cpu_percent, node_cpu_count, node_load1/5/15, node_memory_used/total_bytes, node_memory_percent, node_swap_used/total_bytes, node_rootfs_used/total/avail_bytes, node_rootfs_percent, node_cpu_iowait_percent (time spent waiting on disks — a node at 10% CPU and 30% iowait has no headroom), node_ksm_shared_bytes (memory reclaimed by page deduplication), node_uptime_seconds, node_version_info | node |
| Node services | node_service_running, node_service_state_info (+ state), node_services_failed, node_core_services_down; node_pve_version_info (+ version, release) for the node that answered | node, service |
| Node network | node_interface_active, node_interface_exists, node_interface_autostart, node_interface_mtu, node_interface_offline; total node_interfaces_offline | node, iface, type (bridge, bond, vlan, eth…) |
| LVM, thin pools and mounts | node_lvm_vg_size/free_bytes, node_lvm_vg_used_percent, node_lvm_vg_physical_volumes (label vg); node_thinpool_size_bytes, node_thinpool_used_bytes, node_thinpool_used_percent, node_thinpool_metadata_size_bytes, node_thinpool_metadata_used_percent (labels vg, pool); node_directory_mount_info (+ path, device, fstype), node_directory_mounts | node, vg, pool |
| Guests (VMs and containers) | guest_status_info (+ status: running, stopped, paused, suspended, template), guest_running (not for templates), guest_cpu_percent (of the allocated cores), guest_cpu_count, guest_memory_used/total_bytes, guest_memory_host_bytes (Proxmox VE 9: the memory the VM takes on the host, emulation overhead included), guest_memory_percent (from the guest’s own point of view; on Proxmox VE 9 it comes from the balloon driver, and a VM without one has bytes but no percentage rather than a figure above 100%), guest_disk_total_bytes, guest_disk_used_bytes and guest_disk_used_percent (containers; VMs only through the guest agent), guest_disk_read/write_bytes, guest_network_in/out_bytes (counters), guest_uptime_seconds; guest_pool_info (+ pool), guest_locked (+ lock; the series exists only while the lock is held, so its duration reads straight off the chart) | node, vmid, name, type (qemu or lxc) |
| VM detail (running VMs) | guest_agent_enabled, guest_agent_running, guest_balloon_bytes, guest_memory_guest_free_bytes (free memory seen from inside, balloon driver), guest_running_qemu_info (+ version: the QEMU the VM was started with — after a hypervisor upgrade it stays behind until the VM is stopped and started again, which a live migration does not do); per filesystem guest_fs_total_bytes, guest_fs_used_bytes, guest_fs_used_percent | node, vmid, name, type; filesystems: + mountpoint, fstype |
| Guest system and addresses | guest_os_info (+ os, os_id, os_version, kernel), guest_ip_info (+ iface, ip; four routable addresses per guest at most). Refreshed once an hour | node, vmid, name, type |
| Guest network cards | guest_netdev_in_bytes, guest_netdev_out_bytes (counters), one pair per virtual interface where guest_network_in/out_bytes only gives the guest’s total | node, vmid, dev (tap100i0, veth200i0) |
| Storages | storage_active, storage_enabled, storage_used/total/avail_bytes, storage_used_percent (capacity is published only when Proxmox reports one: an inactive storage, or a PBS datastore whose size PVE does not read, gets none rather than zero bytes) | node, storage, type (dir, lvmthin, zfspool, nfs, pbs…), shared |
| Backups (per guest) | backup_present, backup_last_timestamp_seconds, backup_last_age_seconds, backup_last_size_bytes, backup_count; totals backup_guests_total, backup_guests_without_backup | vmid, name, node, type |
| Backups (vzdump runs, per node) | backup_job_runs, backup_job_failures, backup_job_last_ok, backup_job_last_timestamp_seconds, backup_job_last_age_seconds, backup_job_last_duration_seconds | node |
| Backup jobs (scheduled) | backup_job_enabled, backup_job_next_run_seconds, backup_job_last_ok, backup_job_last_run_age_seconds (the last two only when a vzdump task carries the job id, PVE 7.2+); totals backup_jobs_total, backup_guests_not_covered; backup_covered per guest (0 for a guest no job covers) | job, storage, schedule; backup_covered: vmid, name, node, type |
| Backup job coverage | backup_job_guests, backup_job_volumes_included, backup_job_volumes_excluded; backup_job_guest_excluded_volumes (+ vmid, name, type, reason), published only for an unexpected exclusion | job |
| HA | ha_quorum_ok, ha_fencing_armed (+ state: Proxmox VE 9 reports whether the watchdog is armed or on standby — on standby nothing will be fenced), ha_master_active, ha_lrm_active (node), ha_resources_total; per resource ha_resource_started, ha_resource_error (1 in state error, fence or recovery), ha_resource_state_info (+ state) | sid, node, vmid, type |
| HA manager | ha_node_online, ha_node_status_info (+ status: online, fence, gone, maintenance), ha_master_info (the node holding the CRM master), ha_manager_age_seconds; per node ha_lrm_mode_info (+ mode, state), ha_lrm_age_seconds, ha_lrm_stale (1 when the LRM has not written for more than two minutes) | node |
| Snapshots | guest_snapshot_count, guest_snapshot_oldest_age_seconds, guest_snapshot_newest_age_seconds (ages only when count > 0); guest_snapshot_guests_skipped when max_snapshot_guests is exceeded | vmid, name, node, type |
| Replication | replication_job_enabled, replication_job_error (error message or fail_count > 0), replication_job_fail_count, replication_job_last_sync_age_seconds, replication_job_next_sync_seconds, replication_job_duration_seconds; replication_jobs_total | job, vmid, node (source), to_node |
| Ceph | ceph_health (0 OK, 1 WARN, 2 ERR, 3 unknown), ceph_health_info (+ status), ceph_osds_total/up/in, ceph_bytes_total/used, ceph_used_percent, ceph_pgs_total, ceph_mons_total | |
| Ceph OSDs | ceph_osd_up, ceph_osd_in, ceph_osd_used_percent, ceph_osd_used_bytes, ceph_osd_total_bytes, ceph_osd_apply_latency_ms, ceph_osd_commit_latency_ms, ceph_osd_reweight, ceph_osd_crush_weight; totals ceph_osds_down, ceph_osds_out | osd, ceph_host, device_class |
| Ceph pools and CephFS | ceph_pool_used_percent, ceph_pool_used_bytes, ceph_pool_size, ceph_pool_min_size, ceph_pool_pg_num, ceph_pool_pg_num_optimal (what the autoscaler would pick), ceph_pool_info (+ type, crush_rule, autoscale), ceph_pools_total; ceph_fs_info (+ metadata_pool, data_pool), ceph_fs_total | pool; CephFS: name |
| Ceph flags and mutes | ceph_flag (1 while the flag is set), ceph_flags_set; ceph_health_mute_info (+ sticky), ceph_health_mutes | flag; mutes: code |
| Physical disks | node_disk_size_bytes, node_disk_smart_failed (1 when SMART health is FAILED; absent when the disk reports UNKNOWN), node_disk_health_info (+ health, used: LVM, ZFS, partitions…), node_disk_wearout_percent (SSD and NVMe: 0 new, 100 end of rated life), node_disk_temperature_celsius (from disks/smart: ATA attribute 194/190, or the temperature line of a text report — Temperature: for NVMe, Current Drive Temperature: for SAS) | node, disk (/dev/sda, /dev/nvme0n1), model, type (ssd, hdd, nvme) |
| ZFS pools | node_zfs_pool_degraded (1 unless ONLINE), node_zfs_pool_health_info (+ health), node_zfs_pool_size/alloc/free_bytes, node_zfs_pool_used_percent, node_zfs_pool_fragmentation_percent | node, pool |
| Updates | node_updates_pending, node_updates_security_pending (packages whose origin, repository label, suite, section or changelog URL names a security archive, such as Debian’s bookworm-security). Without Sys.Modify those two do not exist; node_pve_packages_upgradable then still counts the Proxmox packages whose candidate version differs from the installed one, and node_reboot_required (+ running, installed) says a newer kernel is installed but not yet booted — both read from apt/versions, which needs only Sys.Audit | node |
| Package changes | node_packages_changed: 0 normally; for one hour after a probe sees the installed version of a Proxmox package change (apt/versions), the number of packages that changed, with a changes label such as pve-manager 8.2.4→8.2.7, proxmox-kernel-6.8 6.8.8-2→6.8.12-2 | node, changes |
| Subscription and repositories | node_subscription_active, node_subscription_info (+ status: active, notfound, expired…, level, next_due); node_repository_errors (unreadable sources files), node_repository_warnings (Proxmox’s own warnings: enterprise repository without subscription, test repository), node_repository_enabled (+ repo: enterprise, no-subscription, test, ceph-*) | node |
| Certificates | node_certificate_expiry_days (negative once expired) | node, filename, subject |
| RRD stream (off by default) | node_rrd_<metric>, guest_rrd_<metric>, storage_rrd_<metric> — every measurement Proxmox’s own metric servers receive, under its own name (see metrics_export below) | node; guests: vmid, type; storages: node, storage |
| Skipped options | feature_skipped_info: 1 while an optional call is refused (403) for lack of a privilege, absent otherwise. The monitor page shows it as a discreet note naming the privilege; it is neither a probe error nor an alert | feature, privilege |
| Collection | up, scrape_errors, scrape_duration_seconds |
The backup age per machine answers the most expensive failure of a homelab: the
backup that has not run for weeks, discovered on restore day. It is computed
from the vzdump task log (over backup_lookback_days) and, if
scan_backup_storage is on, from the archives found on the backup storages.
Scheduled jobs come from Datacenter → Backup: backup_covered is 0 for every
guest Proxmox itself lists as not covered by any job, so a machine created
yesterday shows up before its first missed backup rather than after.
A job that covers a guest does not necessarily write all of its disks. A
volume marked backup=0 is skipped every night, the job still reports success,
and nobody finds out until a restore. backup_job_guest_excluded_volumes names
the job, the guest and Proxmox’s own reason for the exclusion — but only when
the exclusion is a surprise: a CD-ROM drive, a cloudinit image or an entry that
is not a volume at all is excluded by design, counted in
backup_job_volumes_excluded and never reported per guest. Without that
distinction every machine with a virtual drive would raise an alert.
A node’s daemons are worth watching for one reason: pvestatd stopped does not
break anything visibly — the web interface keeps showing the numbers from the
moment it died, and everything looks normal. node_core_services_down counts
only pve-cluster, pvedaemon, pveproxy, pvestatd, pve-firewall,
corosync and watchdog-mux, and only those the node itself declares as
enabled, so a standalone node without corosync or HA counts nothing missing.
An interface counts as offline when it is set to start at boot and is not up (or no longer exists at all). One brought up on demand, without autostart, is never reported: its absence is normal. A bridge that fails to come back after a reboot cuts off every guest attached to it while each of those guests runs perfectly, and nothing else says so.
An LVM thin pool that fills up puts every guest stored on it read-only at once, and deleting files inside the guests does not give the space back. Its metadata live on their own, far smaller volume and often saturate first, with exactly the same consequence — which is why the two fill levels are separate series and separate rules.
Package changes are detected by the collector itself: it remembers the installed versions from the previous probe (per monitor and node, in memory — a server restart learns again without reporting). Only a package present in both probes with a different version counts; a newly installed or removed package does not.
A partial failure (one node down, one storage slow) is still a successful probe:
what could be read is written and the failure is counted in scrape_errors.
Features that are simply absent stay silent: no Ceph, no replication job, no
ZFS pool, no guest agent, or no right to list updates produce no series and no
error. The same goes for everything above: a missing privilege (403), an
endpoint an older Proxmox does not have (404 or 501), a feature that is not
installed (Ceph answers 500) produce no error and no metric at all — never a
zero pretending to be a measurement.
Board temperatures are not available: the Proxmox VE API does not expose sensors, only the disks’ own SMART temperature. Install the DumbMonit agent on the node if you need more.
Built-in rules that apply: Monitor unreachable, High CPU, Disk almost full, Filesystem almost full (forecast), Backup too old, Unusual CPU, VM or container stopped, VM or container CPU high, VM or container memory high, VM or container disk almost full, HA resource in error, Cluster lost quorum, Node offline, Storage almost full, Backup job failed, Old snapshot, Replication failed, Ceph health error, Ceph health warning, Updates pending, Security updates pending, Proxmox packages changed, Proxmox disk wearing out, Proxmox disk SMART failure, Proxmox ZFS pool degraded, Node certificate expiring, Thin pool almost full, Thin pool metadata almost full, Proxmox service down, Node network interface down, Ceph OSD down, Ceph OSD nearly full, Ceph pool almost full, Ceph noout flag left on, HA manager not reporting, Backup job excludes a disk, Guest locked.
The full RRD stream
Section titled “The full RRD stream”/cluster/metrics/export is the endpoint Proxmox’s own metric servers
(InfluxDB, Graphite) consume: everything pvestatd measures, for the whole
cluster, in one call. Two things make it worth having.
- It carries measurements nothing else exposes — in particular the per-node pressure stall information (PSI): how long tasks spend waiting for the CPU, the disk or memory. That is the number that explains “everything is slow” when CPU and memory both look fine.
- It is read with
history=1from the last point already seen, so every point between two probes is ingested at its own timestamp. A monitor probed every five minutes gets its five one-minute points instead of a single current value.
It is off by default, and that is a deliberate trade. Those series partly
repeat ones the rest of the collection already produces under better names, so
turning metrics_export on adds a large number of series to store and to sift
through for detail most installations never look at. The names are published
exactly as Proxmox sends them (node_rrd_pressure_cpu_some_avg10,
guest_rrd_netin…) rather than translated: Proxmox adds new ones at every
release, and a translation table written here would be wrong by the next one.
It needs Sys.Audit on / — which the DumbMonit role already has when it
was granted on / as below.
What to prepare in Proxmox
Section titled “What to prepare in Proxmox”-
Open Datacenter → Permissions → Users → Add, enter the user name dumbmonit, choose the realm Proxmox VE authentication server, then click Add.
dumbmonit@pve -
Open Datacenter → Permissions → Add → User Permission: path /, user dumbmonit@pve, role PVEAuditor, then click Add.
-
Open Datacenter → Permissions → API Tokens → Add: user dumbmonit@pve, Token ID monitor, untick Privilege Separation, then click Add.
dumbmonit@pve!monitor -
Copy the Token ID and the Secret into DumbMonit’s Token ID and Secret fields. The secret is shown only once.
-
Optional, for the pending-updates count: Datacenter → Permissions → Roles → Create a role with only Sys.Modify, then add it as a User Permission on path /nodes.
-
In DumbMonit, enter the address of any node (port 8006 by default).
Required permissions
Section titled “Required permissions”- PVEAuditor on /: Read-only: nodes, storage, VMs, containers, backups, guest agent
- Sys.Modify on /nodes (optional): Only to list pending updates
- VM.Monitor on / (optional, Proxmox VE 8): Only for the QEMU guest agent options
Vendor documentation: Proxmox VE user management
Why these permissions
Section titled “Why these permissions”Do not reuse the account you log in with: a leaked token would then control the whole cluster. The role below can only read.
PVEAuditoris a built-in role made of the read-only privileges of every category. DumbMonit usesSys.Audit(nodes, cluster, HA, disks and SMART, ZFS, certificates, package versions, subscription),Datastore.Audit(storages and backup archives),VM.Audit(VMs, containers, snapshots) and, on Proxmox VE 9,VM.GuestAgent.Audit(what the QEMU guest agent reads inside a VM: disk usage, operating system, IP addresses). The role also carriesPool.Audit,SDN.AuditandMapping.Audit, which are unused but harmless. None of them can change anything.- Privilege separation is off, so the token simply inherits the user’s rights: one permission on the user is enough.
- Proxmox guards the list of pending updates and pending security fixes with
Sys.Modify. Grant it on/nodesonly, through a role that holds nothing else; without it the collector skips the list silently. - On Proxmox VE 8,
VM.GuestAgent.Auditdoes not exist yet andPVEAuditorlacksVM.Monitor, which covers the guest-agent calls there. Without it the disk usage, operating system and addresses read inside VMs are missing. Create a role holdingVM.Monitorand grant it on/vms. Proxmox VE 9 removedVM.Monitorin turn: do not create that role there. - The Proxmox certificate is self-signed by default: if the connection is refused for that reason, tick “Accept an unverifiable certificate” in the options.
Prefer a shell? The same setup from a node (web UI: select the node, then Shell; or SSH):
pveum user add dumbmonit@pve --comment "DumbMonit monitoring"pveum aclmod / -user dumbmonit@pve -role PVEAuditorpveum user token add dumbmonit@pve monitor --privsep 0pveum role add DumbMonitUpdates --privs Sys.Modifypveum aclmod /nodes -user dumbmonit@pve -role DumbMonitUpdatespveum role add DumbMonitGuestAgent --privs VM.Monitorpveum aclmod /vms -user dumbmonit@pve -role DumbMonitGuestAgentThe last two lines are for Proxmox VE 8 only.
Credentials
Section titled “Credentials”| Credential | Fields |
|---|---|
| API token (recommended) | Token ID: user, realm and token name as Proxmox shows them, dumbmonit@pve!monitor. Secret: the UUID shown once when the token was created. No expiry, no session opened on the hypervisor. |
| Username / password | user@realm and the password. A ticket is obtained, cached and renewed ten minutes before its two-hour expiry. |
The API accepts the token in two pieces (token_id + secret) or, as older
versions did, as one string token = user@realm!name=secret; both are
stored the same way. A whole token pasted into Token ID is split by the form.
The DumbMonit role above carries what PVEAuditor grants for the paths the
collector reads, plus the guest-agent privilege: the collector only ever does GET. Per
endpoint: Sys.Audit for /version, /cluster/*, /nodes/{node}/status,
services, version, network, netstat, tasks, replication,
certificates/info, disks/list, disks/smart, disks/zfs, apt/versions,
apt/repositories and subscription; Datastore.Audit for storage and
storage/{id}/content; VM.Audit for qemu, lxc, snapshot,
status/current, a guest’s config and a container’s interfaces;
VM.GuestAgent.Audit — or
VM.Monitor before Proxmox VE 9 — for agent/get-fsinfo.
Two paths ask for a little more than the rest, and both are covered by the role
as granted in step 3 — on /, not on /nodes:
Sys.Auditon/for the LVM inventory (disks/lvm,disks/lvmthin,disks/directory) and for/cluster/metrics/export, the optional RRD stream. Granted only on/nodes, the thin-pool series and the*_rrd_*series are silently absent.VM.GuestAgent.Auditfor the two guest-agent calls that read a VM’s operating system and addresses (agent/get-osinfo,agent/network-get-interfaces). Proxmox VE 7 did not have that privilege and usedVM.Monitor; Proxmox VE 9 droppedVM.Monitor. Without the one your version knows,guest_os_infoandguest_ip_infoare simply not published for VMs; containers, which need no agent, keep their addresses.
The only thing the role does not cover at all is the list of pending updates
(apt/update), which Proxmox guards with Sys.Modify on /nodes — optional,
as step 6 explains; without it the collector skips node_updates_pending and
node_updates_security_pending silently.
(Use -token 'dumbmonit@pve!monitor' instead of -user in the aclmod
commands for a token created with “Privilege Separation” ticked.)
Address: 10.0.0.10, pve.lan, pve.lan:8006, [fd00::1] or a full URL
https://pve.example.net. The https scheme and port 8006 are added if
missing.
Options
Section titled “Options”| Key | Label | Default | Help |
|---|---|---|---|
port | API port | 8006 | Used if the address does not give a port. |
insecure_tls | Accept an unverifiable certificate | false | Proxmox ships with a self-signed certificate by default: enable this if the connection is refused for that reason. |
request_timeout_seconds | Timeout per request (seconds) | 10 | Time allowed for each API call, from 1 to 120. |
backup_lookback_days | Backup lookback (days) | 31 | Older backup tasks are not examined, from 1 to 3650. |
scan_backup_storage | Inventory backup archives | true | Scans the backup storages to date the last backup of each machine. Disable if the storage is slow to answer. |
nodes | Monitored nodes | (empty) | Names of the nodes to monitor, separated by commas. Empty: every node in the cluster. |
cluster_resources | Read the cluster inventory | true | One call to /cluster/resources lists every node, guest, storage and pool. Keep it on: it is the only source that still sees the guests of a node that stopped answering, and it saves two calls per node. Off, the collector walks /nodes/{node}/qemu and /nodes/{node}/lxc instead, and loses the pools and locks. |
services | Watch node services | true | /nodes/{node}/services and version: the state of the Proxmox daemons of each node and the version installed on it. A stopped pvestatd leaves the whole cluster showing frozen numbers. |
network | Watch node networking | true | /nodes/{node}/network and netstat: bridges, bonds and VLANs with their link state, plus the traffic counters of each guest network card. |
lvm | Watch LVM and thin pools | true | disks/lvm, disks/lvmthin and disks/directory: volume groups, thin pools (data and metadata fill) and PVE-managed directory mounts. Needs Sys.Audit on /; silent otherwise. |
ha | High availability | true | Reads /cluster/ha/status/current and manager_status: quorum, CRM master, the manager’s own view of each node, every LRM with the age of its last report, and every HA resource. |
backup_jobs | Scheduled backup jobs | true | Reads the jobs from Datacenter → Backup and the guests no job covers. |
scan_snapshots | Inventory snapshots | true | One call per guest (four in flight per node). Disable on very large clusters. |
max_snapshot_guests | Snapshot inventory limit | 200 | Guests beyond this number are skipped each probe and counted in guest_snapshot_guests_skipped, from 1 to 10000. |
replication | Replication jobs | true | Storage replication status per node. Silent when the node has no job. |
ceph | Ceph health | true | Reads /cluster/ceph/status. Silent when Ceph is not installed. |
ceph_detail | Watch Ceph in detail | true | Per-OSD state, usage and latency, per-pool usage, CephFS, OSD flags and muted health checks. Three calls on one node plus two cluster-wide, whatever the size of the cluster. Needs ceph on; silent without Ceph. |
backup_volumes | Check what backup jobs include | true | For each scheduled job, which guests it covers and which of their disks it actually writes. Catches a job that succeeds every night while skipping a data disk. One call per job. |
guest_os | Read guest OS and addresses | true | Operating system and IP addresses seen from inside each running guest (QEMU guest agent for VMs, the container namespace for containers). Refreshed once an hour per guest, not at every probe. Needs VM.GuestAgent.Audit on Proxmox VE 8. |
metrics_export | Ingest the full RRD metric stream | false | Reads /cluster/metrics/export, the stream Proxmox’s own metric servers consume, including per-node pressure stall (PSI), and every point since the last probe rather than just the current one. Off by default: the *_rrd_* series it adds partly repeat those already collected. Needs Sys.Audit on /. |
updates | Pending updates | true | Counts the packages apt/update lists. Needs Sys.Modify on /nodes (see above); silent otherwise. |
certificates | Certificate expiry | true | Days left on each node certificate (pve-ssl.pem, pveproxy-ssl.pem, pve-root-ca.pem). |
guest_agent | Ask the QEMU guest agent | true | For each running VM: status/current (balloon, agent flag) and, when the agent is enabled, agent/get-fsinfo (needs VM.GuestAgent.Audit). Four calls in flight per node. Silent when the agent is absent. |
disks | Watch physical disks | true | disks/list plus one disks/smart call per disk: health, wearout, temperature. |
zfs | Watch ZFS pools | true | disks/zfs: health, capacity, fragmentation. Silent without ZFS. |
packages | Detect package changes | true | apt/versions compared with the previous probe; a change is reported for one hour in node_packages_changed. |
subscription | Watch subscription and repositories | true | subscription and apt/repositories: status, warnings, enabled standard repositories. |
Common errors
Section titled “Common errors”| Symptom | Likely cause |
|---|---|
| Certificate error shown on the monitor | Self-signed certificate. Either install a trusted certificate (ACME is built into Proxmox) or enable insecure_tls. The option is never enabled implicitly. |
| Authentication error | Secret pasted into Token ID (or the other way round), “Privilege Separation” left ticked (the token then has no rights), or the DumbMonit role not applied on /. |
| Backup age missing for a guest | No vzdump task in the lookback window and no archive found on the storages; or scan_backup_storage disabled. |
| Slow probes | A backup storage that takes long to list, or many guests to inventory for snapshots. Disable scan_backup_storage or scan_snapshots, lower max_snapshot_guests, or raise request_timeout_seconds. |
node_updates_pending missing | The user or token lacks Sys.Modify on /nodes. Grant the DumbMonitUpdates role of step 6, or ignore: node_pve_packages_upgradable and node_reboot_required cover the Proxmox packages without it. |
| No memory percentage for a VM | Proxmox VE 9 reports, in the cluster inventory, the memory the VM takes on the host — overhead included, so regularly above its allocation. A percentage computed from it would sit above 100% forever. The honest figure comes from the balloon driver inside the guest; a VM with ballooning disabled therefore shows bytes and no percentage. guest_memory_host_bytes is the host-side figure. |
| No capacity for the backup storage | A Proxmox Backup Server datastore mounted on PVE reports no size: PVE does not read it. The datastore’s own monitor page has it. |
| Disk usage empty (“size only”) for a VM | The VM has no QEMU guest agent (not enabled in its options, or qemu-guest-agent not installed inside), or the token lacks VM.GuestAgent.Audit. guest_agent_enabled and guest_agent_running tell which. Containers never need it. |
No node_disk_* series | The token lacks Sys.Audit on / (the DumbMonit role grants it), or the node runs behind a RAID controller that hides SMART: disks/list then reports UNKNOWN and no node_disk_smart_failed is published. |
node_packages_changed fires after a server restart | It does not: the first probe after a restart only learns the versions. A change is reported only between two consecutive probes of the same server process. |
backup_job_last_ok{job=…} missing while backup_job_last_ok{node=…} exists | The vzdump tasks do not carry the job id (Proxmox VE older than 7.2, or jobs run by hand). The per-node run status is still there. |
| No Ceph or replication metrics | Nothing to report: Ceph is not installed, or no replication job is configured. Not an error. |
| No thin pool or volume group on a node card | The lvm option is off, the node has no LVM, or the user holds Sys.Audit on /nodes only — that inventory asks for it on /. |
| The Ceph section is missing while the cluster has Ceph | ceph or ceph_detail is off, or every node answered the detail calls with an error. available: false on /api/targets/{id}/proxmox/ceph means “no Ceph here”, not “not collected yet”. |
| No operating system or IP address for a VM | The QEMU guest agent is not enabled or not installed in that VM, or the token lacks VM.GuestAgent.Audit on Proxmox VE 8 (step 7). Containers need no agent. A guest that just started waits up to an hour: the facts are refreshed hourly, not at each probe. |
| A guest keeps a lock badge | An interrupted backup, migration or snapshot left it behind. qm unlock <vmid> for a VM, pct unlock <vmid> for a container — after checking that the job is really over. |
pve_backup_excludes_disk fires on a machine with a CD-ROM | It does not: drives, cloudinit images and entries that are not volumes are excluded by design and never reported per guest. What fired is a real disk carrying backup=0. |
No *_rrd_* series | metrics_export is off (it is by default), or the user lacks Sys.Audit on /. |