
Synology DSM
Este conteúdo não está disponível em sua língua ainda.
Synology NAS through the DSM web API: volumes, storage pools, disk health, temperature, Hyper Backup tasks, Active Backup for Business tasks, and Synology Drive and Photos. The first reason to monitor a NAS is its disks: a disk that heats up or whose SMART status degrades announces a failure long before a volume falls over.
Package or API?
Section titled “Package or API?”You can use either way, or both on the same NAS. In DumbMonit, Add a monitor > Synology DSM offers the two.
| Agent package (.spk) | DSM API (this page) | |
|---|---|---|
| Connection | The NAS connects out to DumbMonit; no port opened | DumbMonit connects to the NAS (port 5001) |
| Credential | Enrolment token, used once; no DSM account stored | A dedicated read-only DSM account, stored in DumbMonit |
| Reports | CPU, memory, disks, network; RAID arrays, volumes, disk temperatures, packages, SMB/NFS, UPS | Volumes, storage pools, disk health and SMART, temperatures, Hyper Backup and Active Backup tasks, Synology Drive and Photos |
| DSM version | 7.x only | 6 and 7 |
| Needs | Installing the package on each NAS | The NAS reachable from the server (or a relay agent) |
Network ports to open
Section titled “Network ports to open”From the DumbMonit server (or its relay agent) to the device:
| Port | Protocol | Purpose |
|---|---|---|
| 5001 | TCP | DSM API (HTTPS, default) |
| 5000 | TCP | Only with the HTTP protocol option |
What it watches
Section titled “What it watches”All metrics are prefixed dumbmonit_synology_.
| Family | Metrics | Labels |
|---|---|---|
| System | system_info (model, DSM version, firmware…), uptime_seconds, temperature_celsius, temperature_warning, system_crashed, system_need_repair, storage_health | model, dsm_version, firmware |
| CPU and memory | cpu_usage_percent, cpu_user/system/other_percent, cpu_cores, memory_total/used/available/installed_bytes, memory_usage_percent, swap_usage_percent | |
| Network | network_rx_bytes_per_second, network_tx_bytes_per_second | interface |
| Volumes | volume_status, volume_total/used/available_bytes, volume_used_percent, volume_used_warning_percent, volume_used_critical_percent | volume, fs_type, raid_type |
| Storage pools and SSD caches | pool_status, pool_failed_disks, pool_total/used_bytes, and the same four under ssd_cache_ | pool or ssd_cache, name, raid_type |
| Disks | disk_status, disk_smart_status, disk_temperature_celsius, disk_size_bytes, disk_bad_sector_exceeded, disk_life_below_threshold, disk_remaining_life_percent (SSD only: the life the drive says it has left), disk_unc_count (DSM’s unreadable-sector counter, the one it checks against its bad-sector threshold), disk_info | disk, name; on disk_info: model, serial, vendor, firmware, type, ssd |
| Hyper Backup | backup_tasks, backup_running, backup_last_result, backup_last_run_age_seconds, backup_last_success_age_seconds, backup_next_run_in_seconds | per task |
| Synology Drive | drive_up, drive_team_folders, drive_team_folder_info, drive_connections (see below) | drive_team_folder_info: name |
| Synology Photos | photos_installed (see below) | |
| Security settings | update_available, admin_account_enabled, autoblock_enabled, firewall_enabled (0/1; read hourly, administrator account only, optional: absent when DSM refuses) | |
| Collection | up, scrape_errors, scrape_duration_seconds |
Active Backup for Business metrics are the exception: they are prefixed
dumbmonit_abb_ (see below).
volume_status, disk_status and disk_smart_status carry DSM’s own word in
a label (status, smart_status) and a value on one scale: 0 normal, 1
attention (a transient state such as repairing or checking, or a word DSM
introduced that DumbMonit does not know yet), 2 critical (degrade,
crashed, failed…). The unknown deliberately counts as 1, never 0.
A partial failure stays a successful probe: if the storage inventory fails, the
system state and utilisation are still published and the failure is counted in
scrape_errors. Only a failure on the API discovery call or on the connection
condemns the whole probe.
The monitor page
Section titled “The monitor page”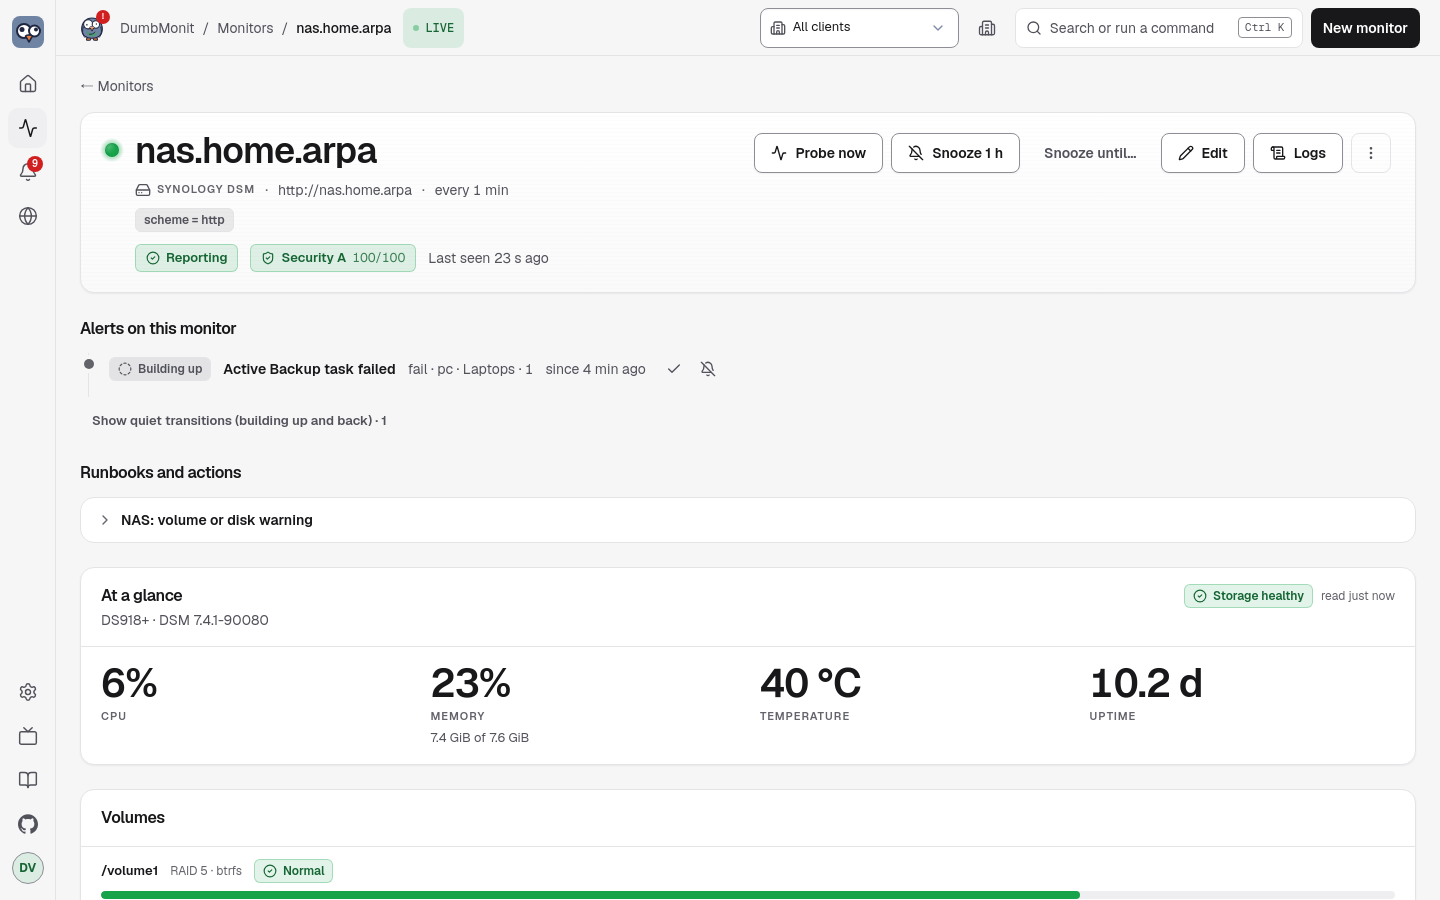
A Synology monitor gets its own panel above the charts:
- At a glance — CPU, memory (used of total), temperature and uptime, with DSM’s own storage verdict as a plate (healthy, attention, crashed, repair needed);
- Volumes — one row per volume: usage bar, used of total, RAID type and file system, the volume’s state in DSM’s word (normal, degraded, crashed, repairing…);
- Storage pools — one row per pool: RAID type, the pool’s state in DSM’s
word, how many of its disks DSM reports as failed, and how much of it is
already handed to volumes. This is where redundancy lives: a RAID 5 that
loses a disk keeps the volume on top of it at
normalwhile it rebuilds, so the volume row says nothing and this one says everything. A pool fully allocated to its volumes is the normal end state, not a warning, so this figure is a sentence rather than a coloured gauge; - SSD cache — one row per cache: its RAID type, its state and its size.
The section is absent on a NAS without a cache. DSM’s
load_infocarries no cache mode or hit rate, so neither is shown; - Disks — one row per bay: model, size, temperature, SMART verdict, DSM’s bad-sector verdict, the unreadable-sector counter and, on an SSD, the life left as a small bar;
- Active Backup for Business — the tasks, then every backed-up device with its rhythm and a thirty-day strip (see below).
Everything comes from what the probe stored: opening the page never queries the NAS.
Built-in rules for the NAS
Section titled “Built-in rules for the NAS”| Rule | Severity | Fires when |
|---|---|---|
| Synology disk SMART warning | advisory | DSM no longer reports the disk’s SMART status as normal, for 15 minutes. |
| Synology disk failed | warning | DSM reports the disk as crashed or failed, for 5 minutes. |
| Synology disk bad sectors | warning | The bad-sector count exceeds the threshold set in DSM, for 15 minutes. |
| Synology disk bad sectors growing | advisory | New unreadable sectors appeared in the last 24 hours (delta(…disk_unc_count[24h]) > 0). |
| Synology SSD wearing out | advisory | An SSD has less than 10 % of its rated life left, for an hour. |
| Synology volume degraded | warning | A volume is degraded or crashed, for 5 minutes. |
| Synology storage pool degraded | warning | A storage pool or SSD cache is degraded or crashed, for 5 minutes. A RAID 5 that loses a disk shows here first: DSM keeps the volume on top of it at normal while it rebuilds. |
| Synology volume almost full | advisory | A volume is 90 % full or more, for 15 minutes. |
| Synology temperature high | advisory | A disk is above 55 °C, or DSM raised its temperature warning, for 15 minutes. |
| Synology memory high | advisory | Memory usage above 95 % for 15 minutes. |
The NAS fleet view
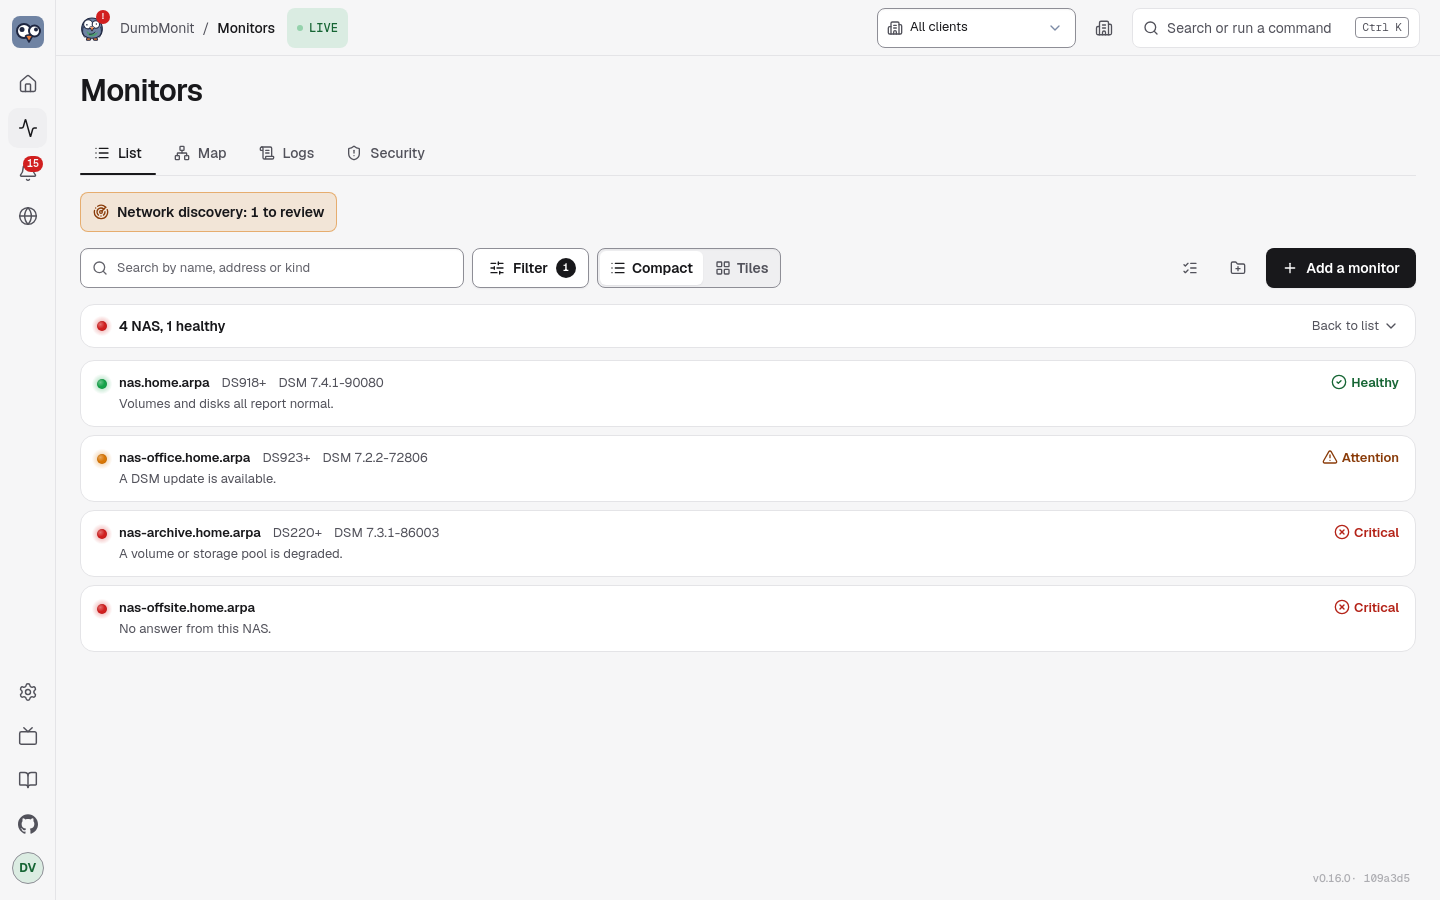
Section titled “The NAS fleet view”With two or more Synology monitors, the Monitors page shows a one-line banner above the list, for example 3 NAS, 1 healthy, with one light for the worst of them. Click View fleet to swap the list for one row per NAS; Back to list brings the list back.
Each row gives the name, the model, the DSM version, a level (a light, an icon and a word, never colour alone) and one sentence saying why. Click a row to open the NAS’s own page. The worst problem decides, in this order:
| Level | Sentence | When |
|---|---|---|
| Critical | No answer from this NAS. | The monitor is unreachable. |
| Critical | A volume or storage pool is degraded. | storage_health is critical (2). |
| Attention | The monitor is misconfigured: open it to fix the settings. | The last probe failed on credentials or options. |
| Attention | A disk or a volume needs attention. | storage_health is attention (1). |
| Attention | A DSM update is available. | update_available is 1. |
| Healthy | Volumes and disks all report normal. | None of the above. |
| Unknown | No reading yet. | The monitor is waiting or disabled. |
The view reads what the probe already stored and refreshes every 30 seconds; it never queries the NAS. A reading that DSM did not give leaves its cell empty. Only Synology DSM monitors count: other NAS brands are not part of this view.
Active Backup for Business
Section titled “Active Backup for Business”Active Backup for Business (ABB) backs up PCs, physical servers, virtual
machines and file servers to the NAS. If the package is installed and running,
DumbMonit reads its tasks on every probe; if it is not, the NAS simply does
not advertise the API and nothing is asked. The option abb turns the whole
family off.
The same holds for Hyper Backup: DSM lists a package’s APIs only while that
package runs, so a NAS whose Hyper Backup is stopped — or which only receives
backups through Hyper Backup Vault — publishes no backup_* metric and
reports no error either. DumbMonit asks the NAS which APIs it has before
calling any of them, so a missing package is silence, never a failed probe.
| Metric | Value | Labels |
|---|---|---|
dumbmonit_abb_tasks | Number of tasks. | |
dumbmonit_abb_task_last_status | Last run: 1 success, 0 failed, 2 running, -1 unknown (never run, cancelled, no backup). A partial success counts as failed: at least one device was not backed up. | task, task_id, source_type, result |
dumbmonit_abb_task_last_success_seconds | Age of the last successful backup run, in seconds. Absent for a task that never succeeded. | task, task_id, source_type |
dumbmonit_abb_task_enabled | 1 if the task has a schedule and is not paused, 0 if it only runs by hand. | task, task_id, source_type |
dumbmonit_abb_task_device_count | Devices attached to the task. | task, task_id, source_type |
task is the task name as shown in ABB; source_type is pc, vm,
physical_server, file_server or nas; result is the raw result of the
last run (success, partial_success, fail, cancel, no_backup,
running, none).
The age is taken from the task history filtered on successful backup runs, not from the task’s “last result”: after a nightly version purge, the last result is the purge, not the backup. This costs one request per task, capped at twenty tasks.
Built-in rules on tasks:
| Rule | Severity | Fires when |
|---|---|---|
| Active Backup task failed | warning | The last run failed, or was a partial success, for 10 minutes. The notification names the task. |
| Active Backup too old | advisory | No successful run for more than two days. |
| Active Backup task disabled | info | The task has no schedule, or its continuous backup is paused, for an hour. |
Devices and their rhythm
Section titled “Devices and their rhythm”A task-level rule is right for a server and wrong for a laptop: people do not leave their laptops on, and “no backup for 24 hours” is Monday morning for every office PC. DumbMonit therefore also watches ABB device by device, against the device’s own habits.
On every probe, the collector reads the per-device runs ABB keeps
(SYNO.ActiveBackup.Overview list_device_transfer_size, one call for all
devices, only what changed since the previous probe) and copies them into its
own database — bounded to ninety days per NAS — so that the model survives a
restart without re-reading a month of history. Then, for each device, it looks
at the last thirty days.
| Metric | Value | Labels |
|---|---|---|
dumbmonit_abb_device_state | 0 ok, 1 idle, 2 learning, 3 running, 4 overdue, 5 failing, 6 never. | device, device_id, task, task_id, state |
dumbmonit_abb_device_overdue | 1 while the device is overdue, 0 otherwise. | device, device_id, task, task_id |
dumbmonit_abb_device_consecutive_failures | Failed attempts in a row since the last success (a cancelled run counts as neither). | same |
dumbmonit_abb_device_last_success_seconds | Age of the last successful run of this device. Absent if it never succeeded. | same |
dumbmonit_abb_device_typical_interval_seconds | Median gap between two successes, off-days excluded. Absent while learning. | same |
How “overdue” is judged
Section titled “How “overdue” is judged”In plain words, for each device:
- Which days is it on? A weekday on which the device attempted at least one backup in the last thirty days — successful or not; a failure proves the machine was on as much as a success — is an active day. Once there are at least two weeks of history, a weekday with no attempt at all is an off-day. A laptop used Monday to Friday gets Saturday and Sunday as off-days; a server has none.
- How often does it back up? The gaps between consecutive successes are collected in active time: the full off-days a gap contains are not counted (Friday evening to Monday evening is one day of active time, not three). Their median is the device’s typical interval; their 90th percentile is what “a slow week” looks like.
- How long is it allowed? The allowance is
max(1.5 × p90 gap, 2 × typical interval, 36 h). A nightly desktop gets 48 h; a machine backed up every three days gets about six; nobody gets less than a day and a half. While fewer than two usable gaps exist (a device added this week), the allowance is 72 h — enough to cross a weekend without a false alarm. - How much active time has passed? The time since the last success, minus the full off-days it contains. A laptop last backed up Friday at 20:00 has, on Monday at 08:00, twelve hours of active time behind it, not sixty.
- The verdict, in this order: running (a backup is in progress); failing (the last two or more attempts failed — a partial success is a failure, a cancelled run is neither); never (no success on record); overdue (active time exceeds the allowance); idle (today is one of its off-days: off, as usual); learning (rhythm not known yet); ok.
Only overdue raises dumbmonit_abb_device_overdue, and only failing feeds
the failure rule. An idle laptop on a Sunday raises nothing; the same laptop
still silent on Tuesday night does.
Days and hours are expressed in the server’s local time (TZ of the
container), which is where the person reading the page lives. The monitor page
shows, per device: the state in a word, the last success and last result, the
rhythm in words (“weekdays, around 20:00”, “every ~3 days, on Mon, Wed, Fri,
around 03:00”, “still learning (2 runs in 30 days)”) and a thirty-day strip —
teal for a day with a success, red for a failure, amber for a cancelled run,
grey for no run.
Built-in rules on devices:
| Rule | Severity | Fires when |
|---|---|---|
| Active Backup device overdue | advisory | dumbmonit_abb_device_overdue > 0 for 30 minutes. |
| Active Backup device failing | warning | Two or more failed attempts in a row, for 10 minutes. |
Synology Drive
Section titled “Synology Drive”DSM does not document the Synology Drive web API. DumbMonit reads three calls
whose name and shape come from the community library N4S4/synology-api,
which calls them from the same screens as the Synology Drive admin console,
and follows the same rule as Active Backup for Business: an API a NAS does
not advertise is a package that is not installed, never a failure.
| Metric | Value | Labels |
|---|---|---|
dumbmonit_synology_drive_up | 1 while the service answers get_status. Absent if the package is not installed. | |
dumbmonit_synology_drive_team_folders | Number of team folders. | |
dumbmonit_synology_drive_team_folder_info | Value 1 per team folder (at most 32). | name |
dumbmonit_synology_drive_connections | Number of active connections (desktop and mobile clients currently synced). |
The drive option (on by default) turns the whole family off.
Synology Photos
Section titled “Synology Photos”Synology Photos ships a well-documented browsing API, but neither Synology
nor the community libraries expose an admin-wide list of mobile backup
devices or their last backup — the mobile app shows its own backup status
locally, and nothing centralises it on the NAS side through an API. DumbMonit
therefore only reports that the package is installed: dumbmonit_synology_photos_installed
(value 1), read from the API catalogue without any extra request to the
NAS — the same catalogue SYNO.API.Info already answers for every other
package. The photos option (on by default) turns it off.
What to prepare on the NAS
Section titled “What to prepare on the NAS”The steps below are the ones the notice next to the form shows. The principle: an account reserved for monitoring, stripped of everything DSM’s API does not need — never the account you log in with.
-
In DSM, open Control Panel → User & Group → User → Create and name the account as follows, with a long password used nowhere else.
dumbmonit -
Join groups: tick administrators.
-
Assign shared folder permissions: tick No access on every shared folder.
-
Assign application permissions: Deny every application except DSM, and Active Backup for Business if you want its tasks read.
-
Keep two-step verification off for this account (Control Panel → Security → Account).
-
In DumbMonit, enter the NAS address (HTTPS, port 5001 by default) and this account’s user name and password.
Required permissions
Section titled “Required permissions”- Group: administrators — DSM’s storage API answers no other account
- Application: DSM — The only application the account needs
- Application: Active Backup for Business — Optional: to read its tasks
Vendor documentation: Create a user in DSM.
Why these permissions
Section titled “Why these permissions”DSM’s API does not need the same rights for every call. System status (model,
version, temperature, uptime) answers to any account. CPU, memory, volumes and,
above all, disk SMART status require the administrators group. On DSM 7, the
“System monitoring” delegation (Control Panel → User & Group → Delegation) is
enough for utilisation but not for the storage inventory. An account without
particular rights therefore gives a NAS that is “alive”, but nothing about its
disks. The shared folder and application settings take the rest of the group’s
rights back.
Two-step verification must stay off: no automated monitor can type a one-time code. If Control Panel → Security → Account enforces it, restrict the rule to groups this user is not in, or exempt it.
Backup packages are read only while they are installed and running: DSM does not advertise a stopped package’s API at all, so Hyper Backup tasks then go quiet instead of failing, and a NAS that only receives backups (Hyper Backup Vault) has no tasks of its own to show. Active Backup for Business additionally answers only an account allowed to use it (Active Backup for Business → Settings → Privileges); otherwise untick DumbMonit’s “Watch Active Backup for Business” option to stop asking.
Credentials
Section titled “Credentials”| Credential | Fields |
|---|---|
| DSM account | User name: the account created above. Password: its password. Two-step verification must be off for this account: no automated monitor can type a one-time code. |
Address: 192.168.1.30, nas.lan or nas.lan:5001. Without a port, 5001 is
used over HTTPS and 5000 over HTTP.
Options
Section titled “Options”| Key | Label | Default | Help |
|---|---|---|---|
scheme | Protocol | https | HTTPS fits a NAS fresh out of the box. HTTP only if DSM listens in clear text only. Choices: https, http. |
port | DSM port | (empty) | Used if the address does not give a port. Empty: 5001 over HTTPS, 5000 over HTTP. |
insecure_tls | Accept an unverifiable certificate | false | A NAS ships with a self-signed certificate by default: enable this if the connection is refused for that reason. |
request_timeout_seconds | Timeout per request (seconds) | 15 | Time allowed for each API call, from 1 to 120. The storage inventory can wake up sleeping disks. |
abb | Watch Active Backup for Business | true | Reads the Active Backup for Business tasks. Needs the package installed and an account allowed to use it; a NAS without the package is simply skipped. |
drive | Watch Synology Drive | true | Reads whether the Synology Drive service responds, its team folders and its active connection count. A NAS without the package is simply skipped. |
photos | Watch Synology Photos | true | Shows whether the Synology Photos package is installed, with no extra request to the NAS. Synology does not expose a list of mobile backup devices through any API. |
Common errors
Section titled “Common errors”| Symptom | Likely cause |
|---|---|
| Authentication error | Wrong password, or two-step verification required for this account. DSM answers HTTP 200 even on failure; the error code in the JSON body is what counts, and DumbMonit reads it. |
| Certificate error | Self-signed certificate: enable insecure_tls. This is a configuration error, never “unreachable”: a NAS that answers is not shown as off. |
| No disk or volume metrics | The account is not in the administrators group (see the note above). |
No dumbmonit_abb_* metrics, scrape_errors at 1 | The account cannot use Active Backup for Business: delegate the package to it, or disable the abb option. Without the package installed there is no error and no metric. |
| Task metrics but no device rows on the page | The NAS does not advertise SYNO.ActiveBackup.Overview (older ABB), or the device is probed through a relay agent, which keeps the history in memory on its side: the metrics exist, the calendar does not. |
| A laptop shows “Overdue” the day after it was added | Fewer than three successes: the model is still learning and allows 72 hours between backups; it settles once two weeks of habits are known. |
| Disks spin up on every probe | The storage inventory wakes sleeping disks. Lengthen the check interval. |