
The monitors page

The list
Section titled “The list”The Monitors page shows every monitor in one of two layouts, remembered in your browser:
- Compact (the default): one line per monitor — status light, name, kind, address, when it was last seen and the state. Children are indented under their parent and dim when the parent is unreachable.
- Tiles: one card per monitor, with a sparkline of a representative metric. A child names the monitor it sits behind.
Devices are grouped by folder; a folder header shows its state only when something inside is not reporting. Administrators reorder monitors by dragging them (Compact layout, unfiltered and unsorted list) or with the keyboard (Space, arrows, Space).
| State | Meaning |
|---|---|
| Reporting | The last probe succeeded, within three periods. |
| Unreachable | The monitor did not answer (timeout, connection refused), or no probe for more than three periods (at least 90 s). |
| Misconfigured | The last probe failed on our side: wrong credentials, invalid address or option, unexpected answer. Shown in the advisory colour with the error; it raises no alert. |
| Waiting | Added, not probed yet. |
| Disabled | Paused: not checked, raises no alert. |
One toolbar holds everything:
- the search box (name, address or kind);
- Filter, which opens the state (All, Needs attention, Reporting, Disabled), kind, sort and tag filters — the number on the button counts the ones in use, and Clear filters resets them. Filters live in the address, so a filtered list can be bookmarked or shared;
- Compact / Tiles;
- Select (administrators), which turns on a checkbox per monitor and a floating bar at the bottom with the bulk actions (enable, disable, move to a folder, delete); Done or Escape leaves the mode;
- ⋯ (more actions): the topology Map, Create folder, Import websites (CSV) and Import from Uptime Kuma;
- Add a monitor, the primary action.
NAS fleet
Section titled “NAS fleet”With two or more Synology monitors, a banner above the list sums them up (3 NAS, 1 healthy). View fleet replaces the list with one row per NAS: model, DSM version, a level and the reason, ready to open. See The NAS fleet view.
A monitor
Section titled “A monitor”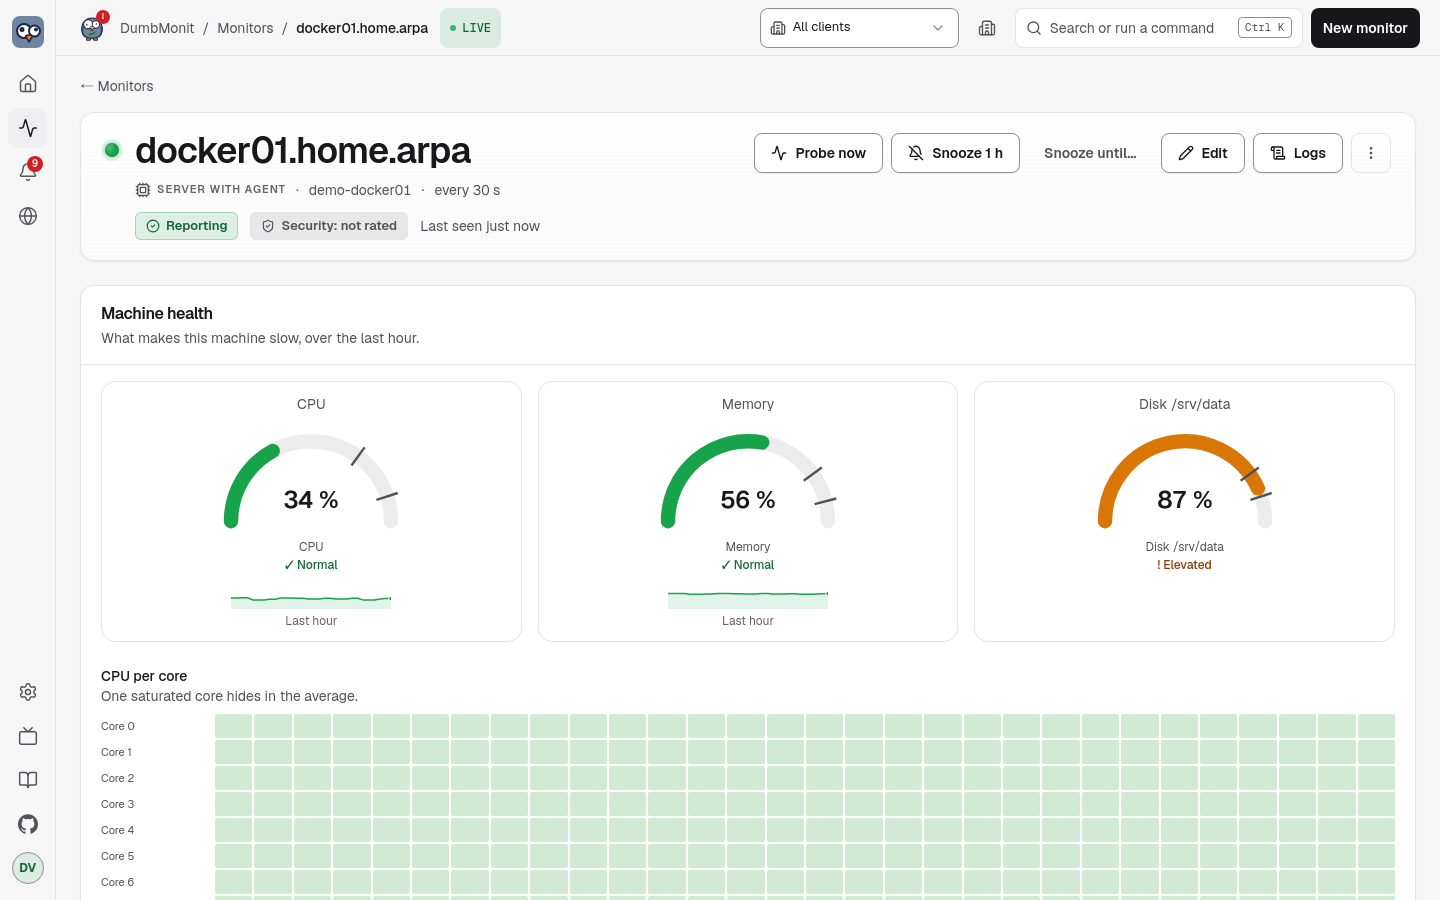
The monitor page shows its state plate, kind, address, interval, last probe, and for services the certificate status. It is for reading data: actions are icon buttons (hover or long-press for the name), and everything that changes the monitor is behind the gear. Actions:
| Action | Effect |
|---|---|
| Probe now (pulse icon) | Runs one probe immediately and reports how many samples and series it produced. The first thing to try when a monitor shows no data. |
| Snooze (bell icon) | A small menu: Snooze 1 h, or Snooze until… for a custom end. A one-off maintenance window on this monitor; the menu lifts it again. |
| Logs | Opens the log search filtered on this monitor. |
| Settings (gear) | Opens the same form as when adding, prefilled. Leaving the credential empty keeps the stored one. For an agent it also holds the relay mode, log collection, the services to watch on its machine and re-enrolment. |
| More (⋯), Delete | Asks “Delete for good?” inline for five seconds, then deletes the monitor. Its series stay in VictoriaMetrics until retention expires. |
Below: Alerts on this monitor — each active alert offers Ack, Snooze and Ignore, and a rule ignored on this monitor is listed separately with Stop ignoring — then Metrics over a time range (1 h, 6 h, 24 h, 7 days), one chart per metric name with one line per series. See Getting rid of an alert.
Services (HTTP, TCP, DNS, ping, TLS) get instruments instead: Availability over the last 24 hours or 7 days, Response time, the number of Checks, and a History bar of slots (oldest on the left) showing when the service was down.
Container policies
Section titled “Container policies”On a machine with an agent and Docker, a Docker strip sits under the header: container count, how many run, updates available, and how many containers have a policy. Manage containers opens the list; Policies… opens a table with two switches per container and an “Apply to all” row:
- Restart if down — the server restarts the container within a minute of it stopping (at most once every ten minutes);
- Auto-update in maintenance windows — when the registry has a newer image for the same tag, the container is recreated during a scheduled maintenance window (Alerts page → Maintenance) and rolled back if it fails its healthcheck.
Each switch saves on its own. Details and safety rules: Docker containers.
Adding and editing
Section titled “Adding and editing”Add a monitor starts with the site: pick a location of the world map, or No site. DumbMonit then proposes what to add there: devices a network scan found through that site’s relay agent and nobody monitors yet (Add creates them at once, except SNMP devices, which open the form for the community), and the monitor types that fit the site (the ones its devices already use, then the common ones). Every proposal is filled in with the site’s relay agent, its location and its usual folder, and you can still change them in the form. Without any location the page is the plain list of types. In MSP mode only the current client’s sites are offered. The setup wizard’s Add your first monitors step offers the same choice.
See Add your first monitor for the form and the monitor types for what each type needs. When editing, the form opens More options by itself if the monitor already uses one.
Deleting
Section titled “Deleting”Deleting a monitor removes it from the configuration, clears its alerts on the
spot — nothing is notified, the history keeps a device removed or disabled
line — and deletes its time series from the embedded VictoriaMetrics a few
seconds later (best effort: a failure is only logged, and the series then age
out with the 12-month retention). Pausing a monitor clears its alerts the same
way; its series stay.