
Status pages
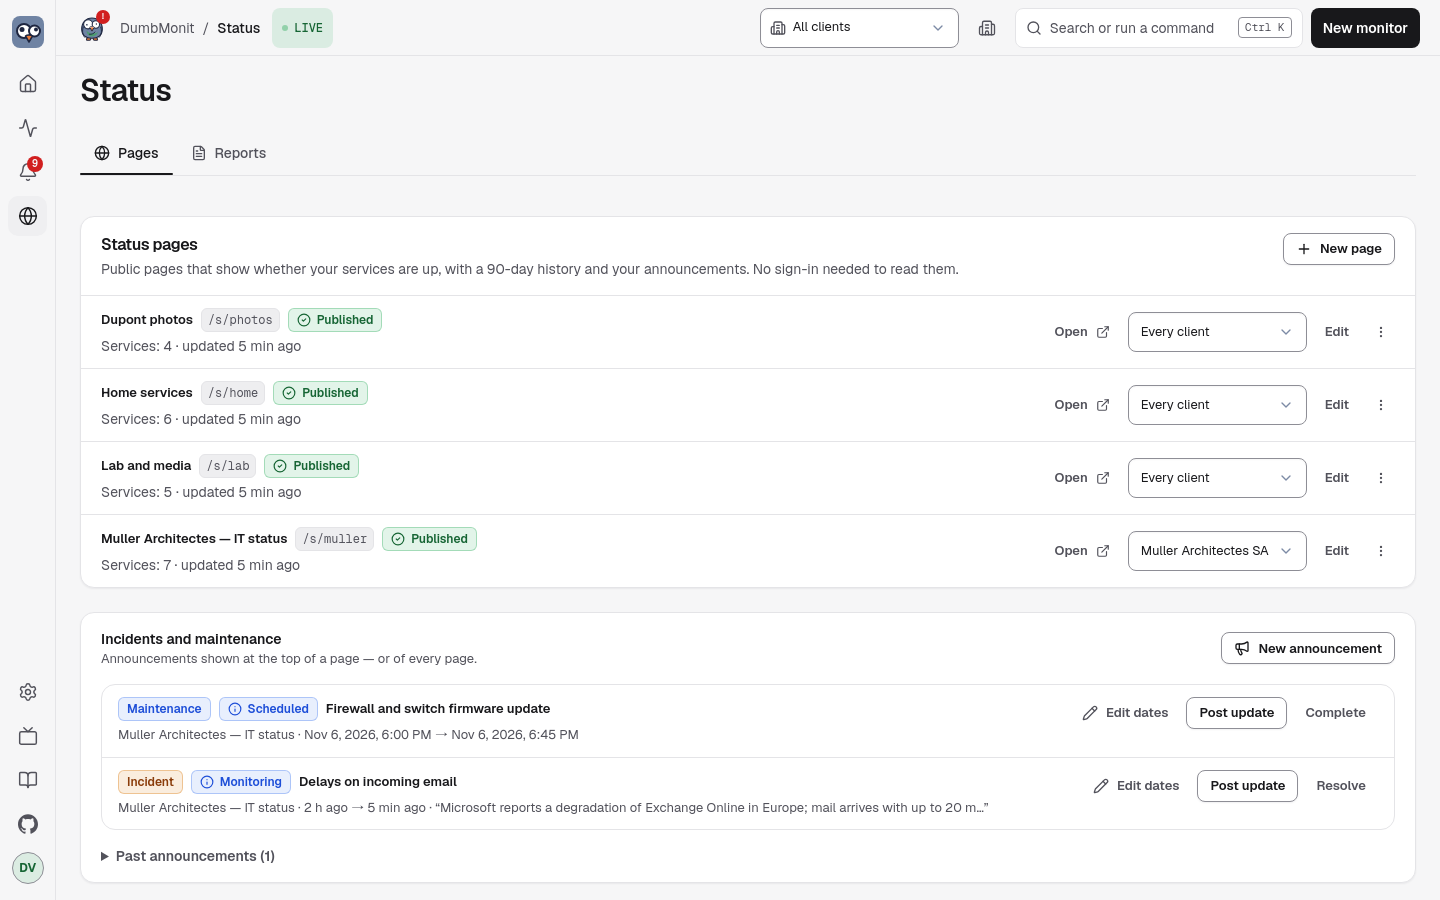
A status page is the public face of your monitoring: a page anyone can open — no sign-in, no cookie — that says whether your services are up, shows up to 90 days of daily history for each of them, carries your incident and maintenance announcements, and lets visitors follow them by RSS or email. Badges put the same answer in a README; a compact view fits in an intranet page.
It only shows what you put on it: the label you give each service, its state, its uptime and its response time. Monitor names, addresses, types and identifiers never leave the server — not in the page, not in a badge, not in an email.
1. Create a page
Section titled “1. Create a page”Status pages (in the icon rail) → New page. That page lists your status pages
(open, edit, delete) with the announcements under them; the editor opens on
its own route (/status/new, /status/<id>). The public rendering is at
/s/<address>. Status pages used to sit in Settings: /settings/status and its
links forward here.
| Field | What it does |
|---|---|
| Title | The heading of the page (“Home lab”). |
| Address | The last part of the URL, /s/<address>. Suggested from the title; lowercase letters, digits and hyphens, 2 to 40 characters. |
| Description | One sentence under the title. Optional. |
| Theme | Day, night, or follow the visitor’s system. |
| History | The period the history bars cover: 24 hours, 7, 30, 60 or 90 days. See The history bar. A page never says more than this — see Badges. |
| Simple mode | A plain page: no scene, no mascot, no animation and no easter eggs. Light or dark follows the visitor’s system, with a toggle in the header; the page’s Theme setting is ignored. |
| Daily calendar | Off by default. Adds a 90-day calendar under the services: one small cell per day, all services combined. See The 90-day calendar. |
| Response times | Off by default. Adds a small response-time graph (24 h / 7 days) to each service that has latency data. See Response times. |
| Published | Off = draft: the page, its badges and its logo answer “not found” to visitors until you switch it on. |
Then tick the monitors to show. For each one, set the label visitors will read (it defaults to the monitor name — you may prefer “Website” to “nginx-front-01”) and, optionally, a group (“Network”, “Storage”). Groups become blocks on the page, in the order you arrange the services.
Two names per monitor. Each monitor in the list shows its private name (its name in DumbMonit, grey, read-only, never published) and an editable public name: the only one visitors, badges, the feed and the page’s search tags ever see. The private name is the placeholder; if you leave the public name empty, the editor warns that the internal name will be published, and it is used. The same goes for monitors that arrive through a ticked group (below): they get their own public-name field.
Groups of monitors. Above the search box, tick a whole monitor group (the folders of Monitors) to show all of it. A ticked group is live: a monitor added to the folder later appears on the page by itself and a removed one disappears. Open a group to see its monitors; the group’s box is partly ticked when only some of them are ticked one by one. The monitors of a ticked group are shown under the group’s name, and a monitor that is both ticked on its own and part of a ticked group appears once (it keeps its own label). Groups are matched by folder name: renaming a folder in Monitors unticks it here.
Save, and the link is ready to copy. The page refreshes itself every minute.
The Look section of the editor dresses the page in your colours without opening it to arbitrary code:
| Setting | What it does |
|---|---|
| Logo | PNG, JPEG or WebP, up to 256 KiB, shown next to the title. Square works best. SVG is refused: it can carry script, and the page is served from the same address as the administration. The file is checked by its content, stored under /data/status-pages/, and served as an image only. |
| Accent | Ink (default), blue, teal, violet, rose or amber — the top rule, the links and the subscribe button. Each one is chosen to stay readable by day and by night. |
| Organisation website | An http:// or https:// link shown next to the title, as the site’s host name. |
| Footer text | Plain text under the page, up to 280 characters: who runs it, how to reach them. Line breaks are kept; nothing is interpreted as HTML or Markdown. |
The Scene setting draws a city skyline behind the banner. New pages start with Paris, and existing pages that had no scene now show it too; untick it for a plain banner, or turn on Simple mode to drop scenes altogether. Pick as many as you like, in the order you want them. Four scenes ship, all four cities at night under the moon and the stars, their landmark lit: Paris (the Eiffel Tower), Tokyo (Tokyo Tower), New York (the Empire State and Chrysler buildings) and Dubai (the Burj Khalifa). The weather follows the page: a clear starry sky when all is well, clouds on a warning, a storm when something is down. Being night scenes, the title and status over them always use the dark colours, whatever the page theme. Dubai replaced the Matterhorn: pages that showed it (or one of the scenes folded onto it) now show Dubai. Pages that used one of the retired scenes (the other cities, the wonders, the Swiss towns and the playful ones) were moved to the nearest of the four: European cities and the ancient world to Paris, Asia and the sea or space scenes to Tokyo, the Americas to New York, the Alps and the north to Dubai; the same goes for backups and API calls that still name them. With more than one, Rotation decides when the page moves to the next: at every visit (default), every minute, every ten minutes or every hour. The scenes are a closed set of drawings shipped with DumbMonit — nothing is uploaded or interpreted. The same four cities can also sit behind the wall’s verdict (Backdrop).
There is deliberately no custom CSS or HTML: a status page is public and lives on the same origin as your admin interface, under the same content security policy.
2. What visitors see
Section titled “2. What visitors see”- A banner with the one-second answer, read from the services: All systems operational, Partial outage (some down or degraded), Major outage (all down) or Scheduled maintenance. An open incident while every service still answers reads Incident in progress, toned by its impact.
- The open announcements, newest update first, with the timeline of updates under a fold.
- Each service with its state plate (Operational, Degraded, Down, Maintenance, No data), its history bar — one square per day — its uptime over 24 h, 7 days, 30 days and (on a 90-day page) 90 days, and the response time for uptime probes.
- Past incidents, by day, for the last 30 days.
- Get updates: the RSS feed, and an email subscription form when you set one up (see Email subscribers).
The history bar
Section titled “The history bar”Choose the period in the editor (History): 24 hours, 7, 30, 60 or 90 days. The bars follow it: hourly for 24 hours, every 6 hours for 7 days, daily from 30 days. The bars also adapt to the data that exists. A page whose oldest service has been monitored for 2 hours shows the last 2 hours in 5-minute bars (not 30 days of grey), 12 hours show hourly bars, 3 days show 6-hour bars. The caption under the bars names the period really shown (“Last 12 hours”) and the availability figure is computed over exactly that period. Time before the first measurement counts neither as an outage nor as 100 %.
Click or tap a bar (or focus it and press Enter) to open that day hour by hour:
availability of each of the 24 hours (UTC), the outages of the day with their
start and end, and the announcements that touched it. Only the public names
appear. The data is also available at GET /api/public/status/<address>/day/<YYYY-MM-DD>.
Each square is one day (UTC), toned by that day’s uptime: full colour at 99.5 % and above, amber from 95 %, red below. A day without any measurement is grey, not green — a service added last week has 83 grey days, not 83 perfect ones. Hover a square, or focus the bar and move with the arrow keys (Home and End jump to the ends), to read the date, the uptime, the minutes of downtime and the incidents that touched that day. The words are there for screen readers too: status is never told by colour alone.
The 90-day calendar
Section titled “The 90-day calendar”Enable Daily calendar in the page settings to show a grid of the last 90 days, a contribution-graph style layout with one column per week. Each cell is a UTC day and takes the worst result among the page’s services that day:
| Cell | Meaning |
|---|---|
| Solid green | Operational: every measured service was at 99.9 % or better and no incident was announced. |
| Striped amber | Degraded: the worst service fell below 99.9 %, or an incident touched that day. |
| Red with a cross | Outage: the worst service fell below 95 %. |
| Empty, dashed | No data: nothing was measured that day. |
Hover, focus or tap a day to read its date, the worst uptime and the number of incidents; arrow keys move between cells. The grid fits a phone screen without scrolling sideways. The page only sends these aggregated cells, never the underlying queries, and nothing at all is sent when the option is off.
Response times
Section titled “Response times”Enable Response times to add a small graph under each service: the average
response time of its checks over the last 24 hours (15-minute slices) or the
last 7 days (2-hour slices), with a switch between the two and the average and
peak spelled out below. Only services that have latency data (probes such as
http, tcp, ping, dns, tls) get a graph; others show nothing. The
page receives the averaged points only, and nothing when the option is off.
How the state is decided:
| State | Meaning |
|---|---|
| Operational | The last probe succeeded (uptime probes), or the monitor reported within three polling periods. |
| Degraded | Up now, but at least one probe failed within the last hour. |
| Down | The last probe failed, the monitor stopped reporting, or its configuration is in error. |
| Maintenance | A maintenance window is in progress and the service is down: expected, not an outage. Either an announcement on this page, or an alerting maintenance window covering that monitor. |
| No data | Never probed yet, or disabled. |
Uptime for probes (http, tcp, dns, ping, tls, heartbeats) is the
share of successful checks, from dumbmonit_probe_success; a day’s downtime is
its failed checks times the probe interval. For other monitors (SNMP, agent,
Proxmox…) it is the share of five-minute slots in which the monitor reported at
least once (dumbmonit_up), counted from the first measurement — a monitor
added yesterday is not “down” for the 89 days before that — and a day’s
downtime is its silent slots.
3. Announce incidents and maintenance
Section titled “3. Announce incidents and maintenance”On Status pages, under the list of pages, Incidents and maintenance → New announcement (also ++ctrl+k++ → Announce an incident).
- An incident has a title, an impact (minor shows the page as degraded, major as an outage) and moves through Investigating → Identified → Monitoring → Resolved. Post updates as you go: each one carries a status and a message, and becomes the latest line visitors read. Resolve closes it with a final message; it then moves to “Past incidents” for 30 days.
- A maintenance window has a start and an end and moves through Scheduled → In progress → Completed. While it is in progress the banner says “Scheduled maintenance” and services that are down show as Maintenance.
A maintenance window scheduled in Alerts does the same thing for the one monitor it covers, without an announcement: that service reads Maintenance instead of red while the window is open, and the page’s overall state says Maintenance when nothing else is down or degraded. Only windows that name a monitor surface this way; the window’s name and comment stay private.
An announcement is shown on one page or on all pages.
Past incidents
Section titled “Past incidents”When you set DumbMonit up, enter the incidents you already had. In New announcement (kind Incident), fill in Started at (your local time; empty means now; the future is refused) and, for an incident that is already over, Resolved at. Add dated updates (Investigating, Identified, Monitoring, Resolved), each with its own date: they are sorted by time, must fall between the start and the resolution, and nothing can follow the resolution.
An incident entered with a resolution is saved as Resolved and nobody is notified: no subscriber email is sent. It appears in the history and in the day-by-day bars and calendar at its real date. When you post an update to an existing incident, Date and time works the same way: empty means now (and subscribers are told); a past date completes the history without notifying anyone. Times are stored in UTC.
Email subscribers
Section titled “Email subscribers”Visitors can subscribe to your announcements by email once you pick an email (SMTP) channel in the editor, under Email subscribers. The channel is one you already configured under Notifications; its server and sender are reused, its own recipients are not. Without one, the page offers its RSS feed only.
- Double opt-in. A visitor enters an address; DumbMonit mails a confirmation link, and nothing else is sent until it is followed. A request never confirmed is forgotten after two days. The form answers the same sentence whether the address is new, pending or already subscribed, so it tells no one who follows your page.
- What is sent. An email when an announcement is created, when an update is posted, and when its status changes — for incidents and maintenance alike, on that page (or on every page, for an announcement shown on all).
- Unsubscribing. Every email ends with a link to unsubscribe, and carries
the
List-UnsubscribeandList-Unsubscribe-Postheaders, so Gmail, Apple Mail and others offer their own one-click button. - Limits. The public subscribe endpoint accepts five requests per client address and sixty in all per 15 minutes, and a pending address is not mailed twice within ten minutes: the page cannot be turned into a mail cannon.
- The editor lists subscribers (confirmed or pending) and removes any of them.
The links in these emails point at the page’s custom domain
when it has one (https://status.example.com/). Otherwise they are built from
the public URL of the
notification policy (or DUMBMONIT_PUBLIC_URL); without one, from
the address you used when you last saved the page — never from a visitor’s
request.
SMS, webhook and Slack subscribers
Section titled “SMS, webhook and Slack subscribers”Besides email, a page can offer three more ways to follow it. Open them in the subscriber panel of the page editor (Subscription channels); the public page then shows one tab per channel.
- SMS. Pick a Vonage, Telnyx or ASPSMS channel from
Notifications; its credentials and sender are
reused, not its recipients. The visitor enters a number in international
format (
+33612345678) and confirms it with a six-digit code sent by text message (five tries, 15 minutes). Updates are one short message with aStop:link. Texts cost money, so SMS sign-ups have lower limits (three requests per client address and 25 in all per 15 minutes). - Signed webhook. The visitor gives an
http(s)URL. DumbMonit POSTs a signedsubscription.confirmrequest carrying aconfirm_url; the subscription starts when the endpoint (or the visitor) calls it. The signing secret (whsec_…) is shown once, on the page, right after the request. Every request carriesX-DumbMonit-TimestampandX-DumbMonit-Signature: sha256=<hex>, the HMAC-SHA256 of<timestamp>.<body>with the secret. The JSON body holdstype(incidentormaintenance),page,incident(id, title, status, severity, dates),messageandunsubscribe_url. The URL goes through the same outbound guard as notification channels (the server’s own addresses are refused). - Slack. The visitor pastes the incoming webhook URL of their own Slack
(
https://hooks.slack.com/services/…). DumbMonit posts a test message with a confirmation link; every update then carries an unsubscribe link. - Services followed. A subscriber can tick the services they care about.
When you create an announcement for a page you can tick the services it
concerns (
componentsin the API): subscribers who follow only other services are not told. An announcement with no service ticked, and a subscriber with none ticked, mean “everything”. - Delivery. SMS, webhook and Slack messages go through a queue: a failure is retried after 1 minute, 5 minutes, 30 minutes, 2 hours, then dropped after five tries or a day. Messages are spaced out so a provider is not flooded.
- Private pages. On a page protected by a password or by sign-in, only someone who can see the page can subscribe.
- Admin. The panel lists subscribers of every channel (phone numbers and
URLs are masked, filter by channel), exports them as CSV
(
GET /api/status-pages/{id}/subscribers.csv; URLs stay masked) and removes any of them. The channels a page opens travel with backups; the subscribers themselves do not.
4. Share the link
Section titled “4. Share the link”The page lives at https://your-server/s/<address>. Everything under /s/ and
/api/public/ is served without authentication; the rest of DumbMonit stays
behind sign-in.
The editor’s Share panel builds the snippets below for you, with a preview.
Badges
Section titled “Badges”Every published page serves SVG badges — flat, with white text on solid colour, readable on both the light and dark themes of a GitHub README:
| Badge | URL |
|---|---|
| Page status | /api/public/status/<address>/badge.svg |
| Page uptime | /api/public/status/<address>/uptime.svg?days=30 |
| Page response time | /api/public/status/<address>/response.svg |
| Service status | /api/public/status/<address>/components/<service>/badge.svg |
| Service uptime | /api/public/status/<address>/components/<service>/uptime.svg?days=30 |
| Service response time | /api/public/status/<address>/components/<service>/response.svg |
<service> is the service’s label in URL form: “Public API” becomes
public-api (a second “Public API” would be public-api-2). It is also the
key of each service in the JSON document. days is 1, 7, 30 (default)
or 90, and never more than the page’s history: a 30-day page refuses a
90-day badge. The page’s uptime and response time are the mean over its
services. A service with nothing measured says no data, in grey.
In a README:
[](https://your-server/s/home-lab)[](https://your-server/s/home-lab)[](https://your-server/s/home-lab)Badges are cached for a minute (Cache-Control: public, max-age=60), so
GitHub’s image proxy and your visitors cost the time-series database nothing.
/s/<address>/embed is a compact view for an iframe: the overall state and
one line per service with its state and 30 days of history, and a link to the
full page in a new tab.
<iframe src="https://your-server/s/home-lab/embed" title="Home lab status" width="100%" height="320" style="border:0"></iframe>Add ?theme=light or ?theme=dark to match the host page, and ?history=0
to hide the bars. The status page and its embed are the only addresses of
DumbMonit a third-party page may frame; everything else (the confirmation and
unsubscribe pages included) answers with frame-ancestors 'none' and
X-Frame-Options: DENY.
Custom domain
Section titled “Custom domain”A page can have its own address, like status.example.com, the way Uptime
Kuma does it. Type the name in the editor’s Public domain field (the
i next to it sums up the steps) and save. When a request reaches DumbMonit
with that name in its Host header, DumbMonit shows the page at the root /,
and nothing else: on that name the sign-in screen, the settings, the API, the
agents’ endpoints, the metrics and the other status pages all answer
404 Not found, even for someone signed in, and no session cookie is read or
set. Only the page, its embed, its confirmation and unsubscribe pages, its
badges, feed and JSON document, and the interface’s own files (/_app/,
icons) are served.
The name is stored in lower case, without https:// or a trailing slash; a
port, a path or an IP address is refused. Two pages cannot share a name, and
the address you use to reach DumbMonit itself (or its public URL) cannot be a
page’s domain — saving it would lock you out. Clear the field to remove the
domain; the page stays at /s/<address> either way.
To set it up:
- DNS. Create the record for the name (or the public hostname of a Cloudflare Tunnel), pointing at your reverse proxy.
- Proxy. Send the name to DumbMonit’s address, for example
https://dumbmonit:8080, without rewriting the path: the proxy forwards/, not/s/<address>. - Host header. Pass the original
Hostheader on: it is how DumbMonit tells the page’s domain from its own address. DumbMonit reads onlyHost;X-Forwarded-Hostcounts only from a proxy listed inDUMBMONIT_TRUSTED_PROXIES. - HTTPS is handled by the proxy. DumbMonit links to
https://<domain>/in subscriber emails, the RSS feed and the editor’s Share panel.
Traefik (Docker labels) — the Host header is passed on by default:
labels: - traefik.enable=true - traefik.http.routers.status.rule=Host(`status.example.com`) - traefik.http.routers.status.entrypoints=websecure - traefik.http.routers.status.tls.certresolver=letsencrypt - traefik.http.services.status.loadbalancer.server.port=8080Nginx Proxy Manager — add a Proxy Host with the domain
status.example.com, scheme http, forward hostname dumbmonit, port 8080,
and an SSL certificate. Nothing else: it passes Host on by default. Leave
the Custom locations empty.
Cloudflare Tunnel — add a Public hostname status.example.com with the
service https://dumbmonit:8080 and no path. The tunnel keeps the visitor’s
Host; leave HTTP Host Header in the advanced settings empty.
Caddy — reverse_proxy passes Host on and Caddy fetches the certificate:
status.example.com { reverse_proxy dumbmonit:8080}Nginx — proxy_pass sends the upstream’s name unless told otherwise, so set
the header:
server {    listen 443 ssl;    server_name status.example.com;    # ssl_certificate … ;
    location / {        proxy_pass https://dumbmonit:8080;        proxy_set_header Host $host;        proxy_set_header X-Forwarded-For $proxy_add_x_forwarded_for;        proxy_set_header X-Forwarded-Proto $scheme;    }}
Troubleshooting.
- The domain shows DumbMonit’s sign-in screen or dashboard: the
Hostheader did not reach DumbMonit — the proxy replaced it with the upstream’s name (dumbmonit:8080). Addproxy_set_header Host $host;(Nginx), remove a custom HTTP Host Header (Cloudflare Tunnel), or remove aHostrewrite middleware (Traefik). Nothing private is exposed: the dashboard still asks for a password. - A bare
Not foundon the domain: the proxy rewrites the path (it sends/s/<address>or adds a prefix), or the domain in the editor does not match the name in the browser exactly. Forward the path untouched. - The page says it does not exist: the page is still a draft — publish it.
- You can no longer reach DumbMonit’s interface: you are browsing through the page’s domain. Use DumbMonit’s own address, or clear the page’s Public domain.
Behind a reverse proxy
Section titled “Behind a reverse proxy”A custom domain is the simplest way to expose only the
status page. If you prefer to keep the /s/<address> path on a public name,
filter the paths in the proxy instead. With Caddy, for example:
status.example.com { @public path /s/* /api/public/* /_app/* /favicon.svg reverse_proxy @public dumbmonit:8080 respond 404}With nginx:
location ~ ^/(s/|api/public/|_app/|favicon\.svg) { proxy_pass https://dumbmonit:8080; proxy_set_header Host $host; proxy_set_header X-Forwarded-Proto $scheme;}location / { return 404; }/_app/ carries the interface’s scripts and styles: the page needs them to
render. Forward X-Forwarded-Proto and X-Forwarded-Host so that the RSS
feed links to the right address, and set the public URL (see above) so that
subscriber emails do too.
Search engines (SEO)
Section titled “Search engines (SEO)”A published page has an SEO block in its editor. By default the page is not
indexed: it answers noindex, nofollow (meta tag and X-Robots-Tag header).
- Let search engines index this page switches to
index, follow, adds the page to/sitemap.xmland lets/robots.txtallow it. Everything else on the instance stays closed to robots. - SEO title (about 60 characters), meta description (about 155), keywords, canonical URL, share image (Open Graph / Twitter), language and site or organisation name. A field left empty uses a value generated from the page name, shown as its placeholder. A live preview shows the result as a search engine draws it.
- Copy the prompt for an AI copies a prompt filled with the page’s name,
organisation, listed services, language and address. Paste it in ChatGPT (or
any assistant), then use Paste the result to fill the fields from its JSON
answer (
title,description,keywords,canonical,image,lang,site_name). Invalid fields are left out with a message.
The tags are written by the server into the HTML of /s/<address> (and of the
root of a custom domain): <title>, description, robots,
canonical, Open Graph, Twitter card, language and JSON-LD data. Crawlers and
link previews do not run JavaScript, so they read them as is. A page that is a
draft, unknown or not indexable never shows its title, and the /embed,
/confirm and /unsubscribe variants are never indexed.
Private pages
Section titled “Private pages”By default a page is open to anyone with the link. Who can see this page, in the editor, changes that:
- Anyone with the link: the default.
- Anyone with the password: visitors see a password form first. The password (8 characters at least) is stored hashed with Argon2id and never shown again; leave the field empty to keep the current one. A correct password sets a signed access cookie, valid for 12 hours. Changing the password ends every access already granted. Mistakes are counted per address and per page: after five, the next attempts wait 30 seconds, doubling up to five minutes.
- Signed-in DumbMonit users: any account, local, LDAP or SSO, whatever its role. Visitors without a session are sent to the sign-in screen and come back to the page. The session cookie belongs to the main address, so this mode does not work behind a custom domain: use a password there.
A page that is not public is never indexed, whatever its SEO block says: it
answers noindex, nofollow, stays out of /sitemap.xml and shows no title in
the HTML. Everything that leaves the page by its address follows the same
access: the JSON document, the badges, the RSS and iCal feeds, the logo,
the day detail and email subscription. The responses carry Cache-Control: private, no-store. A badge is an image loaded by the reader’s browser, so it
only shows where that browser already holds access; on a README it stays broken.
The embed and the website banner need the
same access too.
Maintenance calendar (iCal)
Section titled “Maintenance calendar (iCal)”Planned maintenance can be followed from a calendar app (Google Calendar, Outlook, Thunderbird, Apple Calendar) that subscribes to an iCalendar feed:
GET /api/public/status/<address>/maintenance.ics: the maintenance announced on the page (and those for every page), from 90 days back to the far future. It follows the page’s access mode and is linked under Get updates on the public page.GET /api/calendar/maintenance.ics?token=…: every maintenance of the instance. The token is in the address and is the only protection: share the address like a password. Administrators read it, and replace it with New address, under the page editor’s Maintenance calendar block.
Each maintenance is one event, with its title, its start, its end (one hour when none is set) and its latest message as description. Incidents are not listed.
Third-party providers
Section titled “Third-party providers”Your page can show a provider you depend on, next to your own services. Add a Third-party service status monitor (Cloudflare, GitHub, Atlassian, AWS…) and put it on the page like any other monitor: it appears with an External tag, its own history and the usual states. The provider’s page is read at most once a minute and shared between monitors and pages.
Feed and document
Section titled “Feed and document”GET /api/public/status/<address>/rss— an RSS feed of incidents and maintenance windows, one item per announcement with its latest update.GET /api/public/status/<address>— the JSON document the page is built from, if you want to build your own: the page’s title, description and look, the overall state, each service’skey,label,state, uptime (uptime_24h,uptime_7d,uptime_30d,uptime_90d),latency_msandhistory(date,uptime_pct,down_minutes,incidentsper day), and the announcements.
Any website may read that document from the browser (it is sent with
Access-Control-Allow-Origin: * and no cookies). GET /api/public/status/<address>/banner.js is a ready-made script that turns it
into a banner: see Website banner.
The document is cached for 30 seconds on the server; the badges, the feed and the embed all read that same cached document, so none of them can say more than the page.