
Add your first monitor
This content is not available in your language yet.
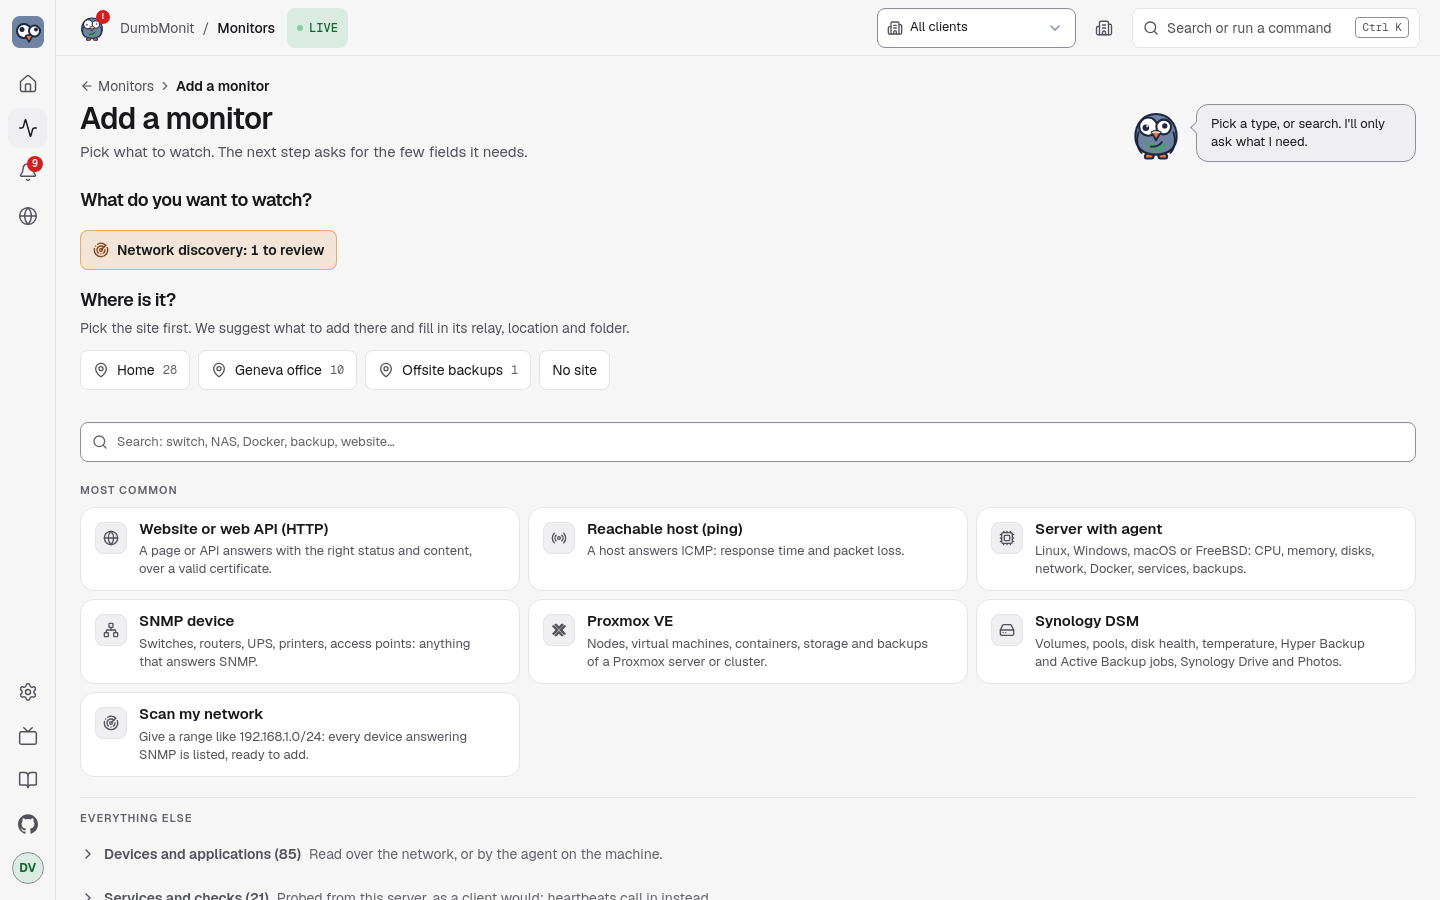
Adding anything always works the same way: pick a type from the list, a notice on the right explains what to prepare on the device, and the form only shows the fields that matter for that type.
The three first steps
Section titled “The three first steps”On a brand-new instance the overview does not show an empty bulletin: it shows a short guide — add your first monitor, connect a way to be told, check a message arrives. Each step is one click, and each turns green on its own. The third one only counts a message that really left a channel, so creating a channel and never testing it does not tick it.
The guide is kept on the instance, not in the browser: skipping a step, or the whole guide, skips it in every browser and for every user. It disappears for good once the three steps are settled, and it never appears on an instance that already had monitors and a channel — upgrading does not hand an established homelab a tutorial.
Add an SNMP device
Section titled “Add an SNMP device”SNMP is the most universal type: almost every piece of network hardware speaks it. Switches, routers, NAS, UPS and printers are the usual suspects.
- On the device, enable SNMP v2c and note the read-only community (
publicby default on many devices). If the device filters by address, allow the DumbMonit server’s address. - In DumbMonit, open Monitors and click Add a monitor (or press ++ctrl+k++ and type “add”).
- Pick SNMP device. The picker folds into one row and the form shows the fields for SNMP.
- Enter a name, the address (IP or host name) and the community. For SNMP v3, switch the credential to SNMP v3 and fill in the user name and the authentication and privacy passphrases.
- Click Add monitor.
The collection profile is detected automatically from the device’s
sysObjectID, in the background, so the form never waits for an unreachable
device. Interfaces, and on servers and NAS the CPU, memory and storage, appear
within a minute.
Scan a network
Section titled “Scan a network”Rather than typing monitors one by one, scan a range:
- On Add a monitor, open the Scan my network panel.
- Enter a network in CIDR notation, for example
192.168.1.0/24(up to 4096 addresses per scan), and the community to try on every address (publicby default). - Every address that answers is listed with its
sysName, description and the profile that would be applied. Monitors already in DumbMonit are marked Already added, and everything new is ticked for you. - Untick what you do not want, then click Add n monitors. They are created one by one, each row showing its own outcome, so one failure never stops the rest.
Add a Proxmox VE server
Section titled “Add a Proxmox VE server”The same flow, with a credential in two fields rather than one:
- In Proxmox, create a user reserved for monitoring, a read-only role and an
API token — the four
pveumcommands are in the notice next to the form, with a copy button each, and on the Proxmox VE page. Never reuse the account you log in with. - In DumbMonit, Add a monitor → Proxmox VE.
- Enter a name and the address of any node (port 8006 by default).
- Copy the token’s full-tokenid (
dumbmonit@pve!monitor) into Token ID and its value (the UUID) into Secret. Pasted the wholeuser@pve!name=secretstring into Token ID by mistake? The form splits it and says so. - Proxmox ships with a self-signed certificate: tick Accept an unverifiable certificate under More options if the first probe complains about it.
- Click Add monitor.
Proxmox Backup Server works the same way with
proxmox-backup-manager; a Synology NAS takes a
dedicated DSM account (user name and password); a
server with the agent needs no credential at all, only
the enrollment token shown once the monitor is saved.
The setup notice
Section titled “The setup notice”Every type carries its own notice, written by the server and shown next to the form: numbered steps to do on the device (create a read-only user, create an API token, allow the address…), with the exact menu path in the product and a copy button on every command or value, then a common pitfall and a link to the vendor’s documentation when there is one. The per-kind pages in this documentation carry the same steps word for word — a test in the server keeps them identical: SNMP, Proxmox VE, Proxmox Backup Server, Synology DSM, agent, services.
The principle behind every notice: a dedicated read-only account, never the one you log in with. A leaked monitoring secret must not be able to change anything.
Common fields
Section titled “Common fields”Whatever the type, the form has:
| Field | Meaning |
|---|---|
| Name | How the monitor appears in lists and alerts. |
| Address | IP, host name, host:port or URL depending on the type; the placeholder shows the expected shape. |
| Credential | The families the type accepts, each with its own fields: community, SNMP v3 user and passphrases, Proxmox token (Token ID + Secret), user name and password. Secrets have a show/hide eye and pasted values are cleaned of stray spaces, quotes and line breaks. Stored encrypted, never returned by the API: on edit, blank fields keep what is saved. |
| Check interval | How often DumbMonit reads the monitor. Default 60 s, minimum 10 s. |
| Parent monitor | If the parent goes down, alerts from this monitor are suppressed instead of sent. See dependency suppression. |
| Enabled | A paused monitor is not checked and raises no alerts. |
| Tags | Free key/value labels, copied on every series as tag_<key>. Type-specific options live here too, under More options. |
What happens next
Section titled “What happens next”- The monitor shows up on the Monitors page as a rack faceplate: status LED, name, kind, address, last seen, and a sparkline.
- Measurements are written to VictoriaMetrics every 5 seconds
(
DUMBMONIT_FLUSH_INTERVAL_SECS), so the first graph appears after the first probe plus a few seconds. Probe now on the monitor page forces a probe and reports how many samples and series it produced: it is the main diagnostic tool. - The built-in alert rules apply immediately: monitor unreachable, CPU saturated, disk almost full, and so on. Nothing to configure.
- To be notified, add a notification channel in Settings → Notifications. Built-in rules notify every enabled channel.